Do you know how many of the people who signed up for your store last month actually bought something?
Getting a customer to place a first order matters. Understanding who those customers are, whether they come back, and what they think of your store is where long-term growth happens. The customer reports in your Salla dashboard turn that into numbers you can act on: how fast your customer base is growing, how satisfied it is, what it likes to buy, and which customers carry the most revenue.
In this guide, you'll learn where to find the general customers report, what every metric in it measures, which detailed customer reports are available, and how to read the numbers when they move.
Customer reports live in your Salla dashboard under Reports. The general report, found under store performance, shows new customers, buyers, satisfaction, ratings and loyalty at a glance. The detailed reports break the same audience down by purchase preferences, geographic distribution, and repeat purchases.
📌 Article overview
- The general customers report
- The detailed customer reports
- Worked examples: how to read your customer reports
- Frequently asked questions
👣 The general customers report
1. From your store's main menu, click (Reports), then click (Store performance).

2. Choose the report type (Customers).
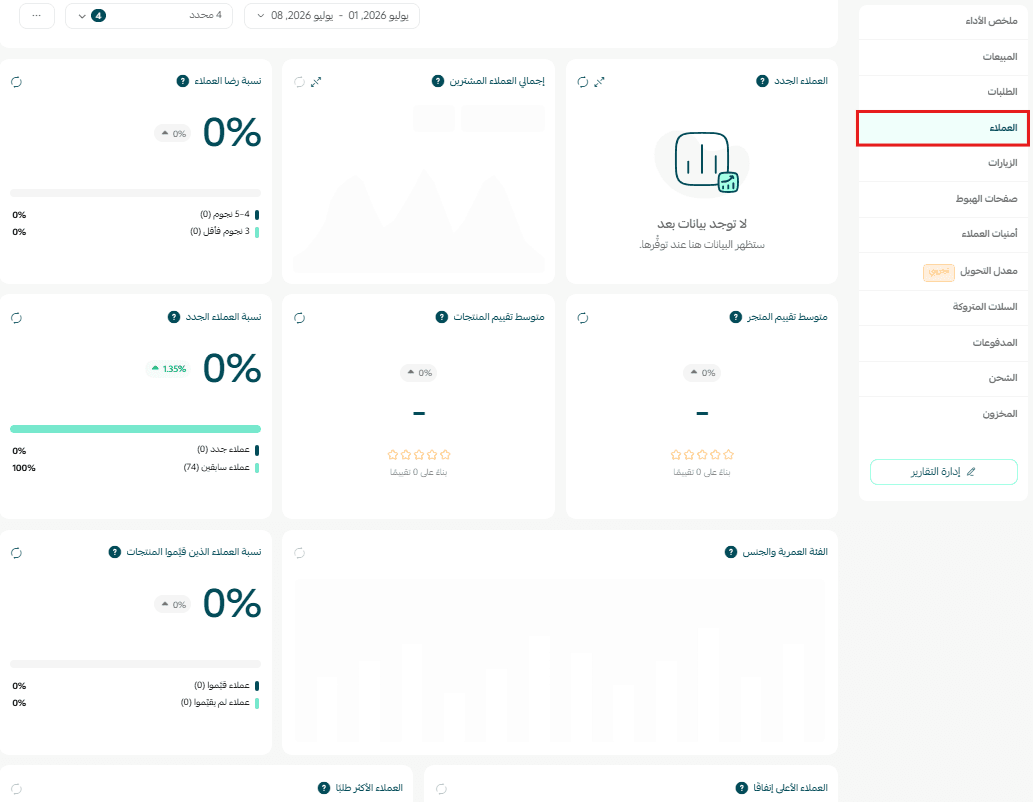
🎯 The general customers report puts the headline numbers for your whole customer base in one view: new customers, customers who bought, satisfaction, ratings, and loyalty signals.
New customers
The number of people who created an account for the first time during the selected period.
How it's calculated
New customers = accounts created during the selected period.
Total buying customers
The number of distinct customers who placed at least one order during the selected period.
Customer satisfaction rate
The share of positive ratings your store received out of all ratings.
How it's calculated
Customer satisfaction rate = (ratings above 3 stars ÷ total ratings) × 100
💡 Note: deleted ratings and ratings submitted without stars are not counted.
Average store rating
The average rating customers gave your store, across all ratings.
How it's calculated
Average rating = total stars ÷ number of ratings.
Average product rating
The average rating customers gave the products in your store.
New customer percentage
New customers gained during the selected period, as a share of your total customer base.
How it's calculated
New customer percentage = (new customers in the period ÷ total customers at the end of the period) × 100
Customer distribution by age group and gender
How your customers break down by age group and gender, so you can see who your store actually attracts.
How it's calculated
- Age is calculated from the customer's date of birth.
- When no date of birth is on file, the customer's age is assumed to be 37.
- Gender comes from the account data, and any value other than "female" is counted as male.
Percentage of customers who rated products
The share of customers who left a product rating, out of all customers.
Top spending customers
Your customers ranked by total purchase value, highest to lowest.
Most frequent buyers
Your customers ranked by the number of orders they placed.
Percentage of customers with loyalty points
The share of customers who hold active loyalty points.
How it's calculated
Loyalty percentage = (customers with points ÷ total customers) × 100
Percentage of customers with a wallet balance
The share of customers who hold a positive balance in their wallet.
How it's calculated
Wallet percentage = (customers with a balance above zero ÷ total customers) × 100
Percentage of customers who referred others
The share of customers who successfully referred at least one new customer.
How it's calculated
Referral percentage = (customers who made referrals ÷ total customers) × 100
📝 Important notes
The age split is an estimate, not a fact. Every customer without a date of birth is counted as 37 years old, so the more incomplete your customer profiles are, the more the middle age bracket is inflated.
Gender is derived from account data on a two-value basis: anything not recorded as "female" is counted as male, including blank values.
🔍 The detailed customer reports
1. From the (Reports) tab in the main menu, click (Reports).
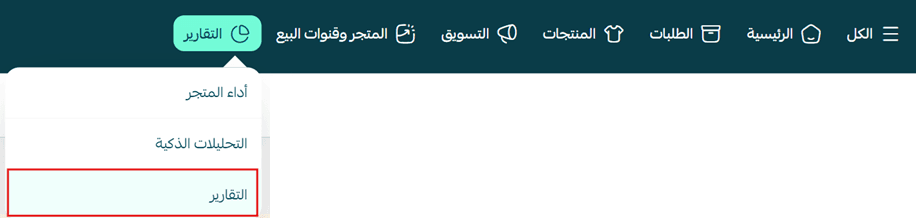
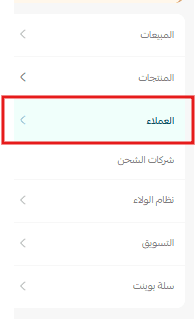
2. Choose the (Customers) section.
3. Select the report you want to view.
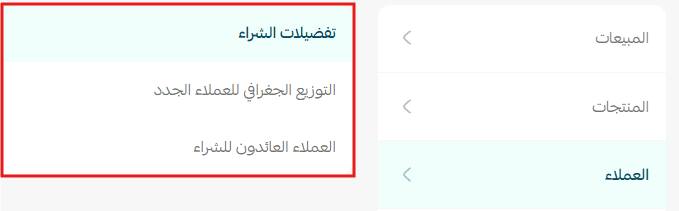
The detailed customer reports are:
Purchase preferences
Shows the products and categories your customers favor, so you can see what they are interested in and shape the shopping experience around it.
For more detail, see the customer report by purchase preferences.
Geographic distribution of new customers
Shows where your new customers are, by region and city, so you can see which areas your customer base is growing in.
For more detail, see the new customers geographic distribution report.
Returning customers
Shows the customers who bought from your store again, so you can track loyalty and repeat purchases.
For more detail, see the returning customers report.
💡 Worked examples: how to read your customer reports
Example 1: new customers went up but sales didn't
The numbers: last month, 300 new customers and SAR 120,000 in sales. This month, 600 new customers and SAR 122,000 in sales.
What it means: your registered customer base is growing, but only a small share of those people completed a purchase.
What to do: review the customer journey after signup, turn on welcome messages or a first-order coupon, and make sure the checkout steps are simple and clear.
Example 2: more buyers, fewer new customers
The numbers: last month, 500 new customers and 800 buyers. This month, 300 new customers and 850 buyers.
What it means: acquisition slowed, but your existing customers kept buying. That is a good loyalty signal.
What to do: keep the loyalty program and the offers aimed at existing customers running, and put more effort into acquiring new ones.
Example 3: customer satisfaction dropped
The numbers: last month, a satisfaction rate of 96%. This month, 84%.
What it means: something has hurt the customer experience — late shipping, product quality, or customer service.
What to do: read the negative ratings, find the reason that repeats most often, and fix it directly before it affects your store's reputation.
Example 4: low product ratings despite strong sales
The numbers: average store rating 4.8 out of 5, average product rating 3.7 out of 5.
What it means: customers are happy with the buying experience overall, but some products are not meeting their expectations.
What to do: review the low-rated products, update the descriptions and images if they don't reflect the product accurately, or improve the product itself.
Example 5: most customers sit in one age group
The numbers: 70% of your customers are between 25 and 34.
What it means: this group is the largest slice of your store's audience.
What to do: aim your campaigns and ad messaging at this group, and lead with the products and offers that suit their interests.
Example 6: very few customers rate products
The numbers: 2,000 customers in total, only 120 of whom rated a product.
What it means: few customers are sharing their experience, which leaves new visitors with less to go on when they decide whether to buy.
What to do: encourage a rating after the order arrives — a reminder message, or loyalty points in exchange for a review.
Example 7: a handful of customers drive most of the revenue
The numbers: 10 customers account for 30% of total store sales.
What it means: you have high-value customers contributing a large share of revenue.
What to do: give them something exclusive — special offers, early access to new products, or loyalty rewards — to keep them.
Example 8: few customers hold loyalty points
The numbers: 5,000 customers in total, only 350 of whom hold loyalty points.
What it means: few customers are using the loyalty program. It may not be visible enough, or the reward may not be compelling.
What to do: explain the program's benefits inside the store, and send a notification when points are earned or are close to expiring.
Example 9: wallet balances are up but going unused
The numbers: 500 customers hold a wallet balance, but few of them came back to buy.
What it means: you have customers holding credit that could bring them back, and they haven't spent it yet.
What to do: remind them the balance is there, paired with a limited-time offer that gives them a reason to use it now.
Example 10: the referral rate is low
The numbers: 4,000 customers in total, only 60 of whom referred a friend.
What it means: the referral program isn't spreading as expected, or customers don't know it exists.
What to do: simplify how a referral works, reward both sides fairly, and tell customers about the program through email and in-store notifications.
❓ Frequently asked questions
Where do I find customer reports in Salla?
The general customers report is under (Reports) then (Store performance), with the report type set to (Customers). The detailed reports are under the (Reports) tab, then (Reports), then the (Customers) section.
What's the difference between the general report and the detailed customer reports?
The general report gives you every headline number for your whole customer base in one view. Each detailed report focuses on a single behavior: what customers prefer to buy, where new customers come from, and who buys again.
Which ratings count toward the customer satisfaction rate?
Ratings above 3 stars count as positive. Deleted ratings and ratings submitted without stars are excluded from the calculation entirely.
Why does the age breakdown include customers who never gave a date of birth?
When no date of birth is on file, the report assumes the customer is 37. Read the age distribution as an estimate, and expect it to skew toward that value when profiles are incomplete.
How is the new customer percentage different from the new customers count?
The count is the absolute number of accounts created in the period. The percentage compares that number to your total customer base at the end of the period, so it tells you how fast the base is growing rather than by how much.
🔥Check your customer reports on a regular schedule. Reading them consistently is what turns a list of metrics into decisions — where to spend on acquisition, which products to fix, and which customers are worth keeping close. 🚀