Are complex reports making it hard to track store performance and make quick decisions?
In this guide, you will learn how to access your Store Reports easily from the main dashboard. We will also walk through monthly goals and provide a clear overview of all available detailed reports.
📌 Article overview:
- Store Reports page
- Types of reports
1. Sales reports
2. Product reports
3. Payment and shipping reports
4. Loyalty system reports
Store Reports Page
1. From the main menu, click Reports.

2. The Store Reports page provides detailed reports across the following sections: Sales, Products, Customers, Payment methods and shipping, and Loyalty system.
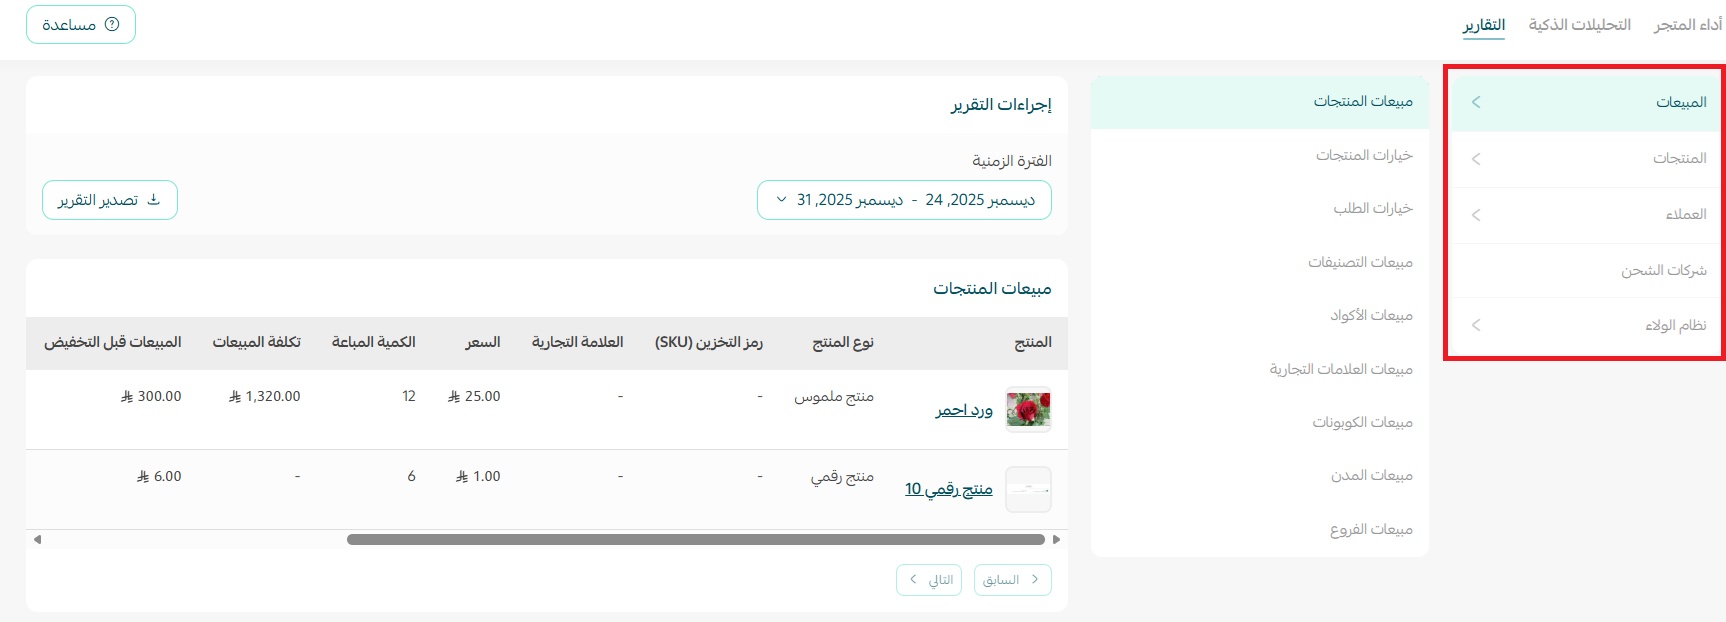
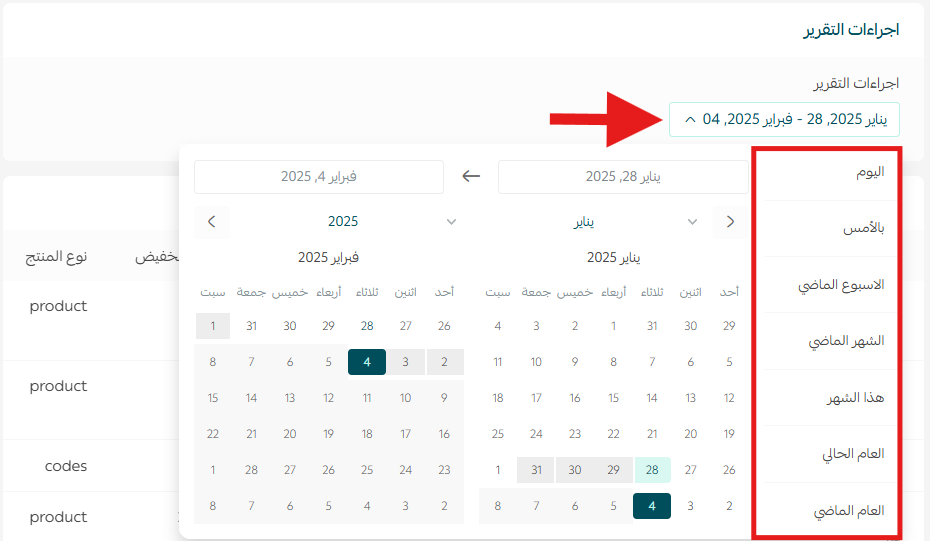
3. Choose the section you want to review, then select the report date from the list.
4. From the report types menu, select the specific report you want to view, such as the Sales by product report.
Your selected report will appear with clear data and structured insights:
Types of Reports
The Reports section is divided into several main categories. Some categories include specialized sub-reports. Below are the reports available on Salla.
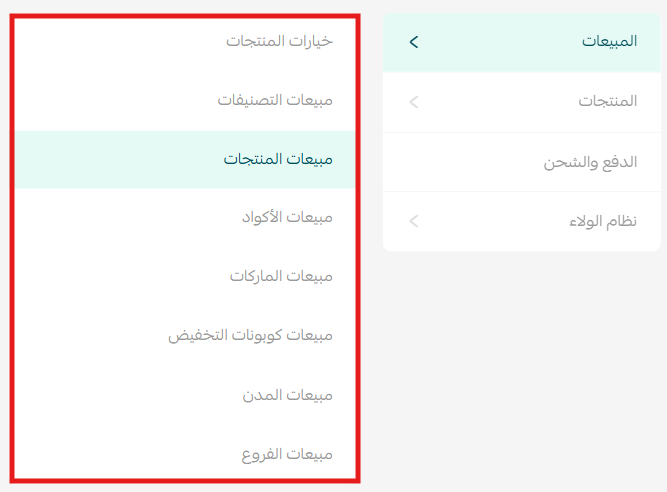
1. Sales Reports
Sales reports give you a comprehensive view of sales performance and include the following sub-reports.
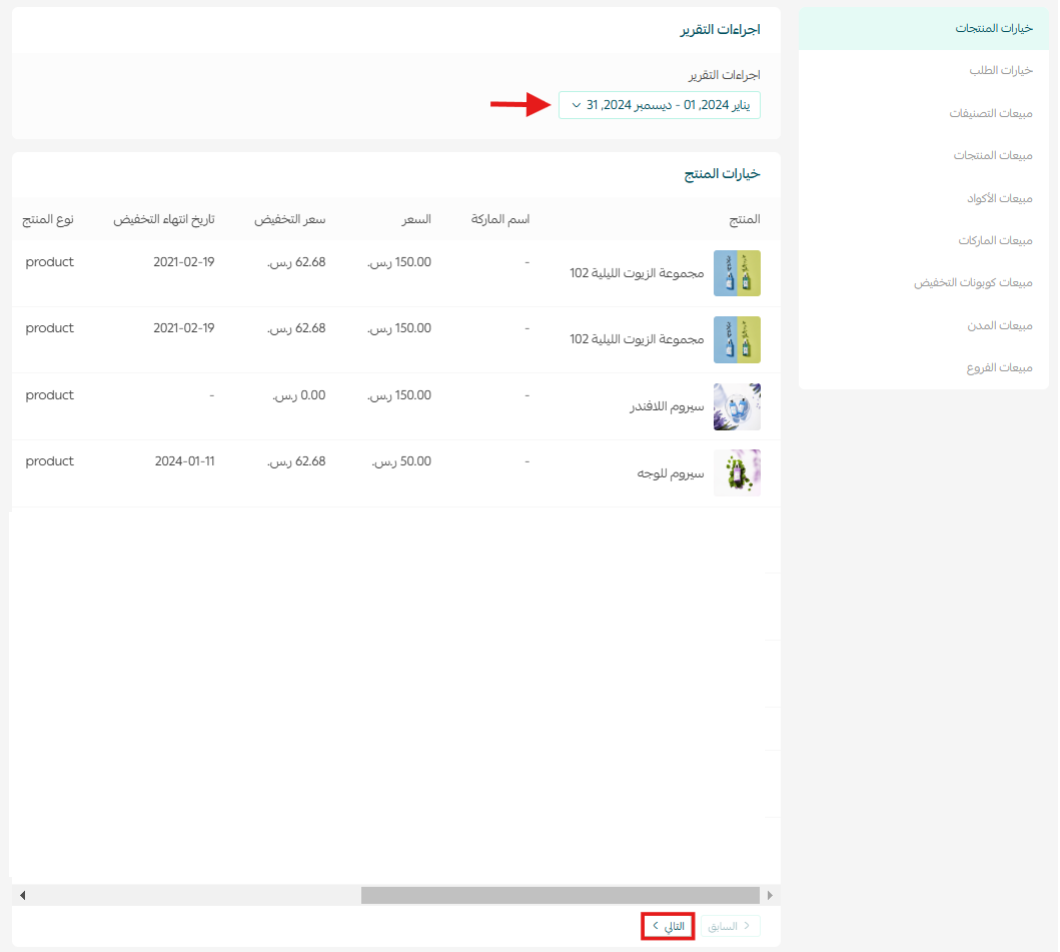
- Sales by product options
View sales by product option for a selected time period. Choose Sales by product options, set the date range, and navigate between pages easily.
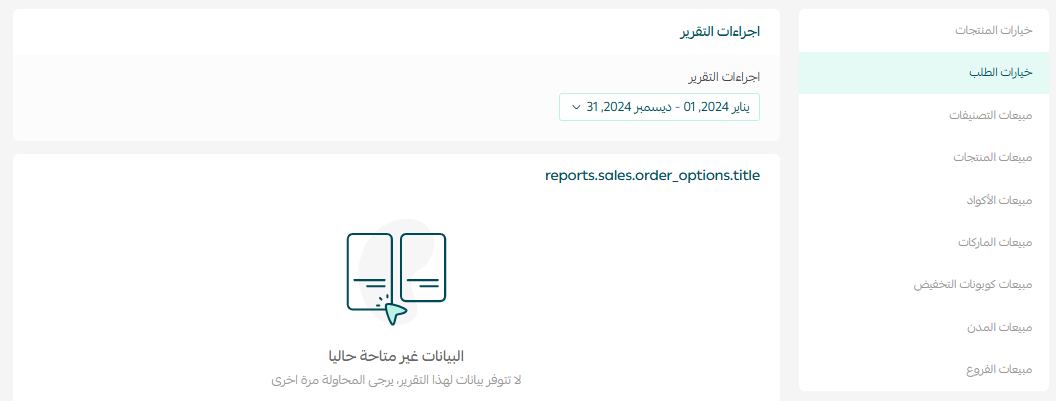
- Sales by order options
View order option sales within a selected time period by choosing Sales by order options and adjusting the date range.
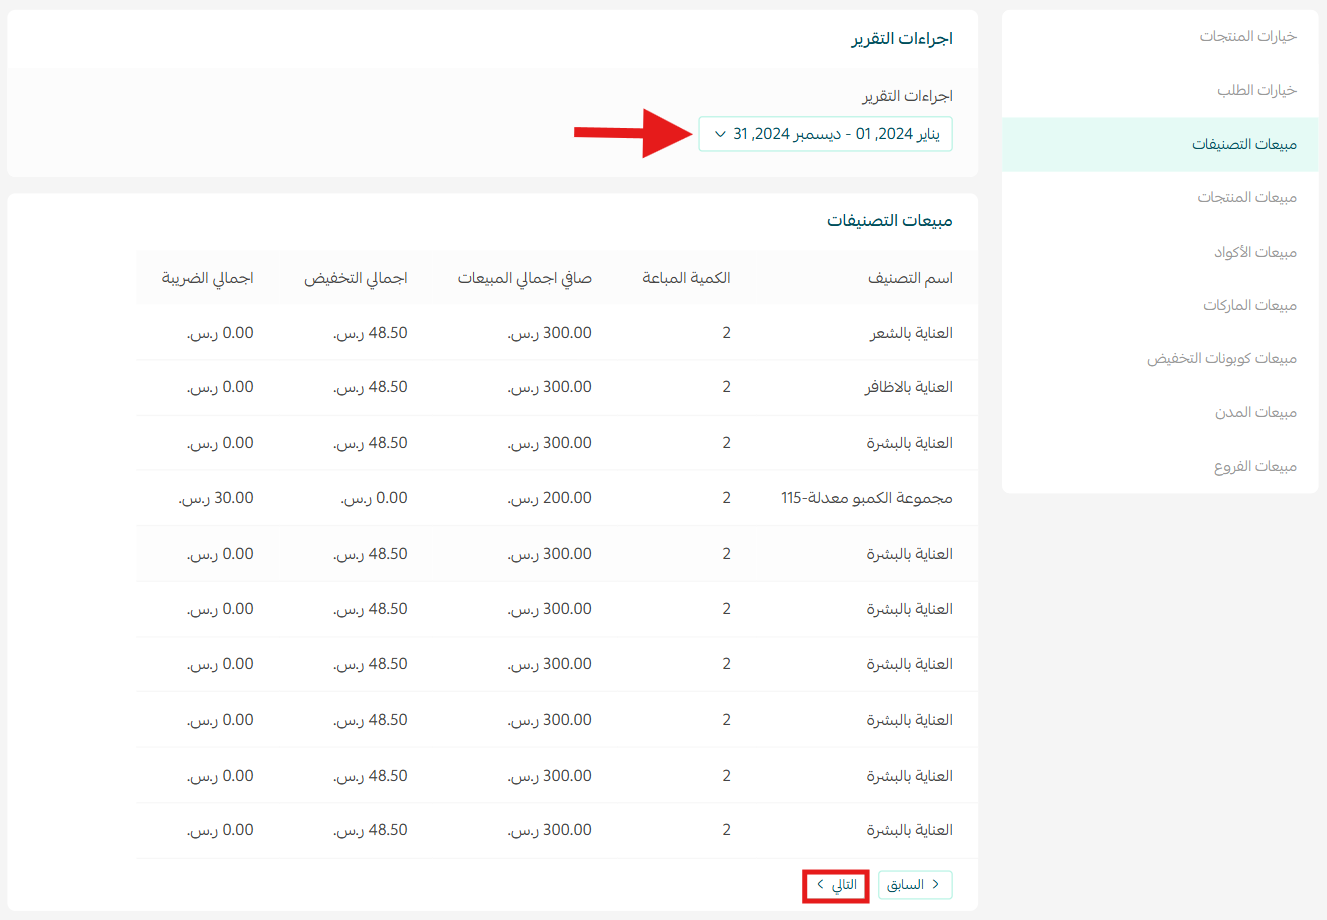
- Category sales
Analyze sales by category. Select Sales by category, choose the time period, and navigate the results easily.
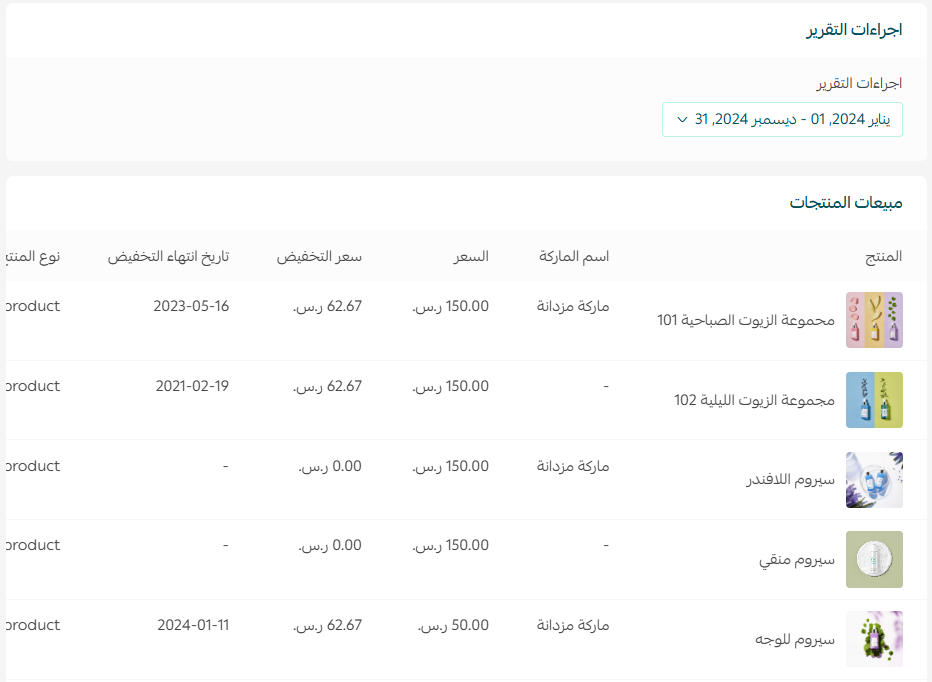
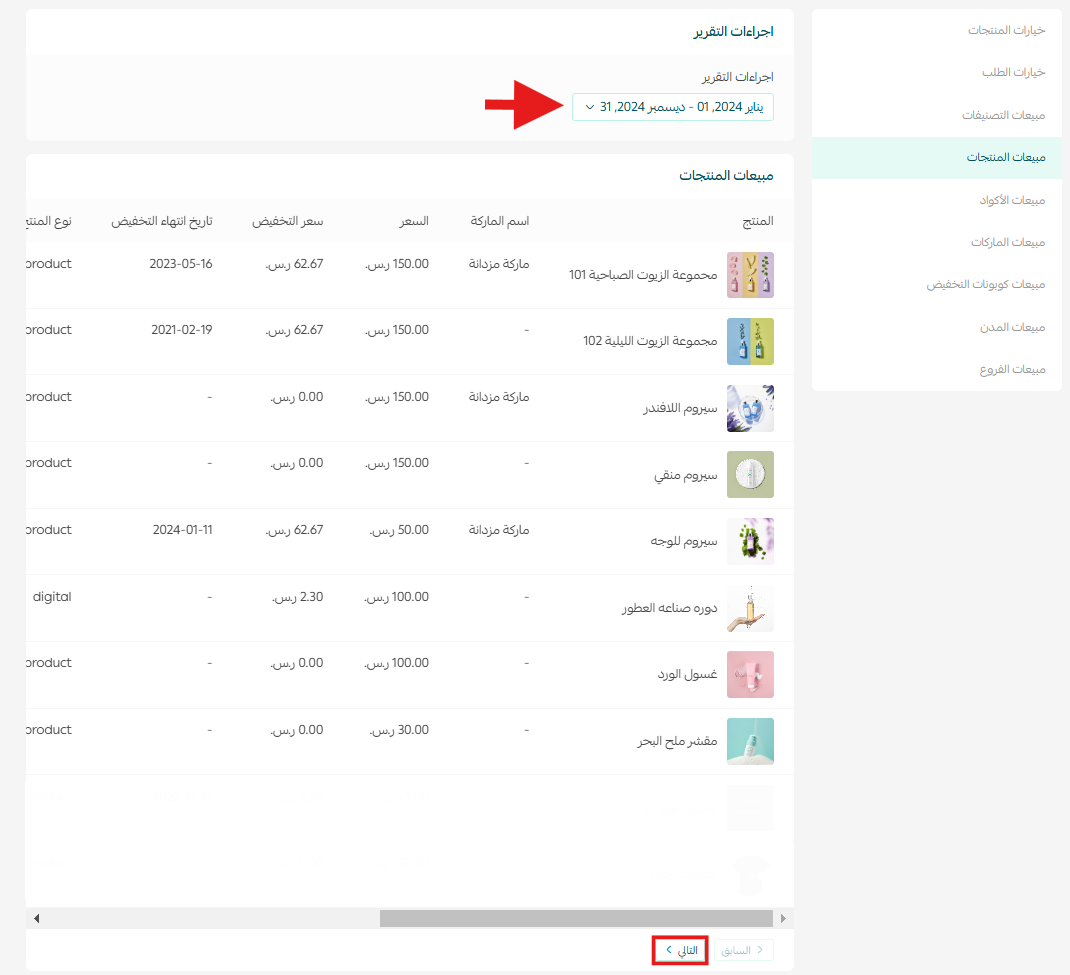
- Product Sales
Review product sales performance by selecting Sales by product and setting the desired date range.
- Discount Code Sales
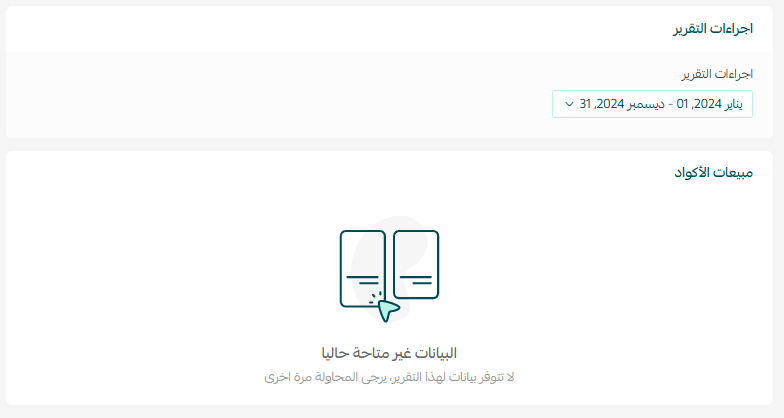
Track sales generated from discount codes by selecting Code sales and choosing the appropriate date range.
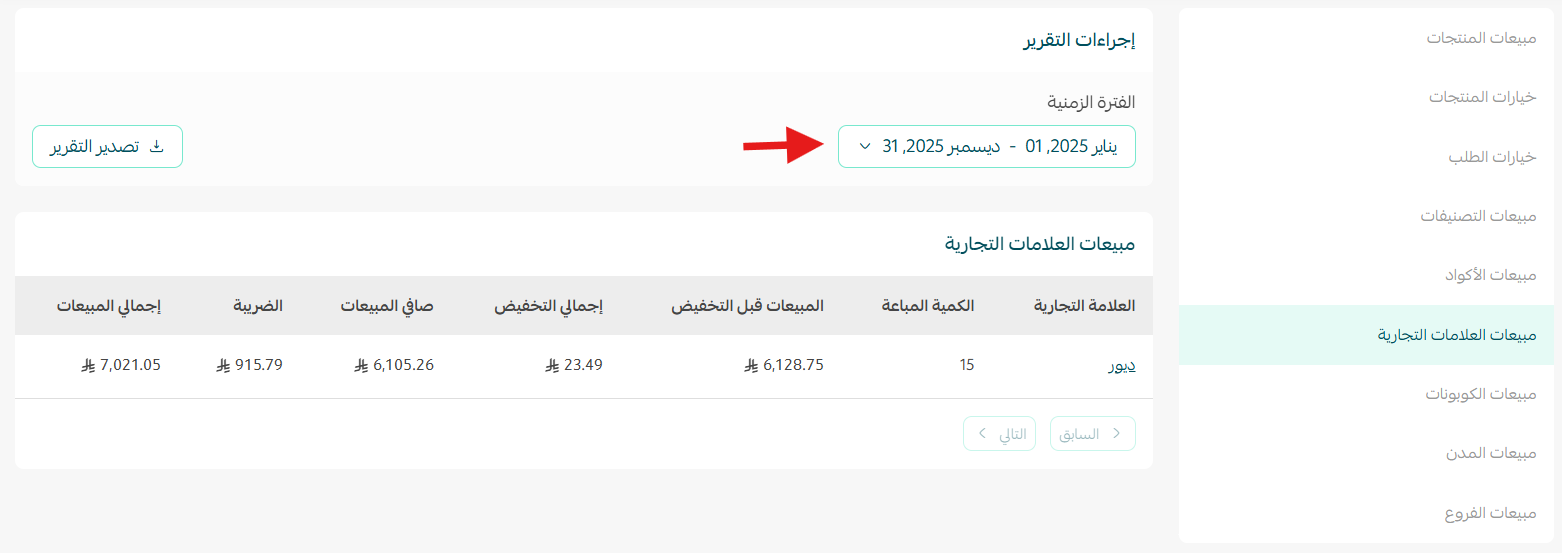
- Brand Sales
Analyze sales by brand. Select Sales by brand, set the date range, and review the results.
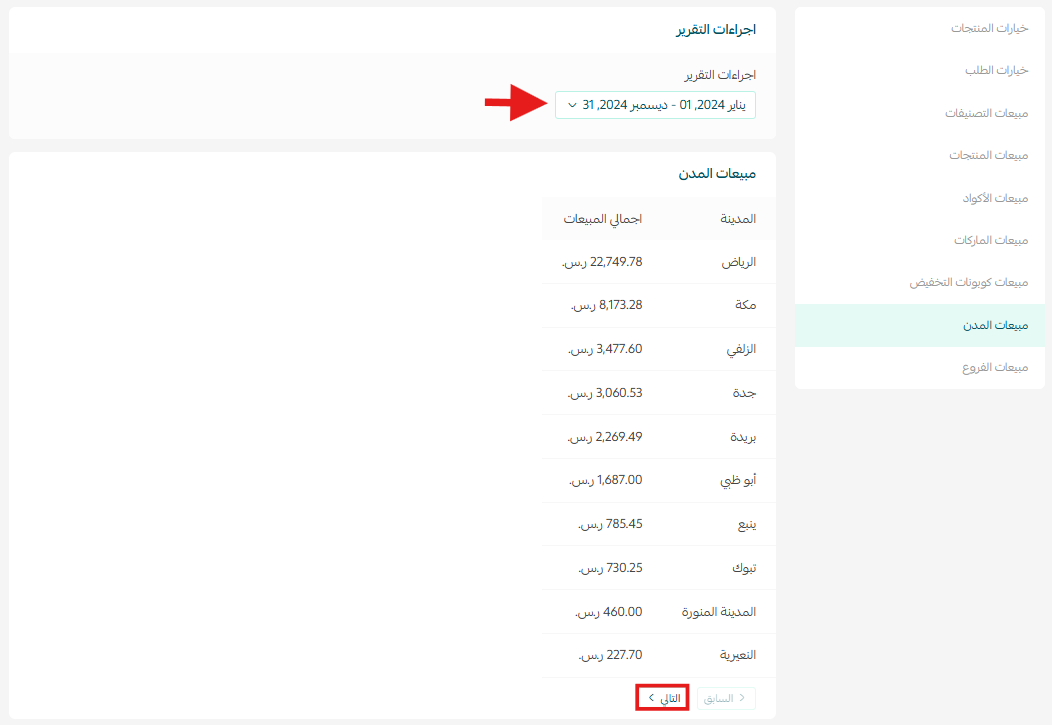
- City Sales
Analyze sales performance by city. Choose Sales by city, set the date range, and browse the results.
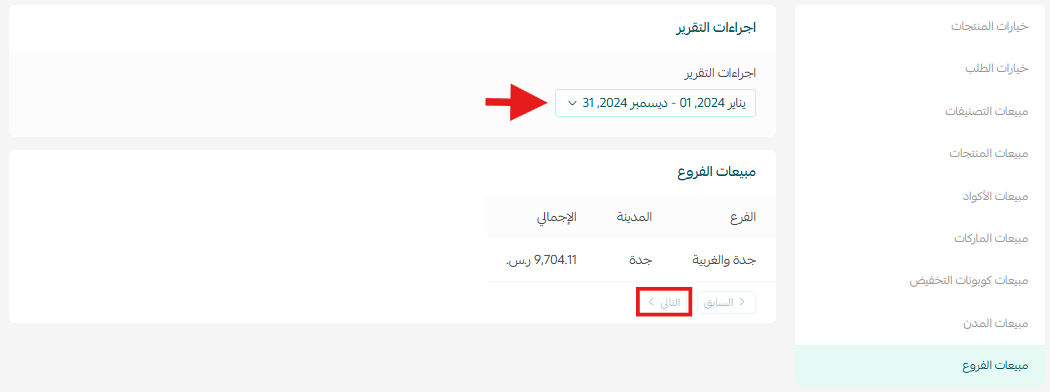
- Branch Sales
Track sales by branch by selecting Sales by branch and choosing the time period.
2. Product Reports
Product reports help you analyze product performance and customer interaction by providing detailed insights into product behavior.
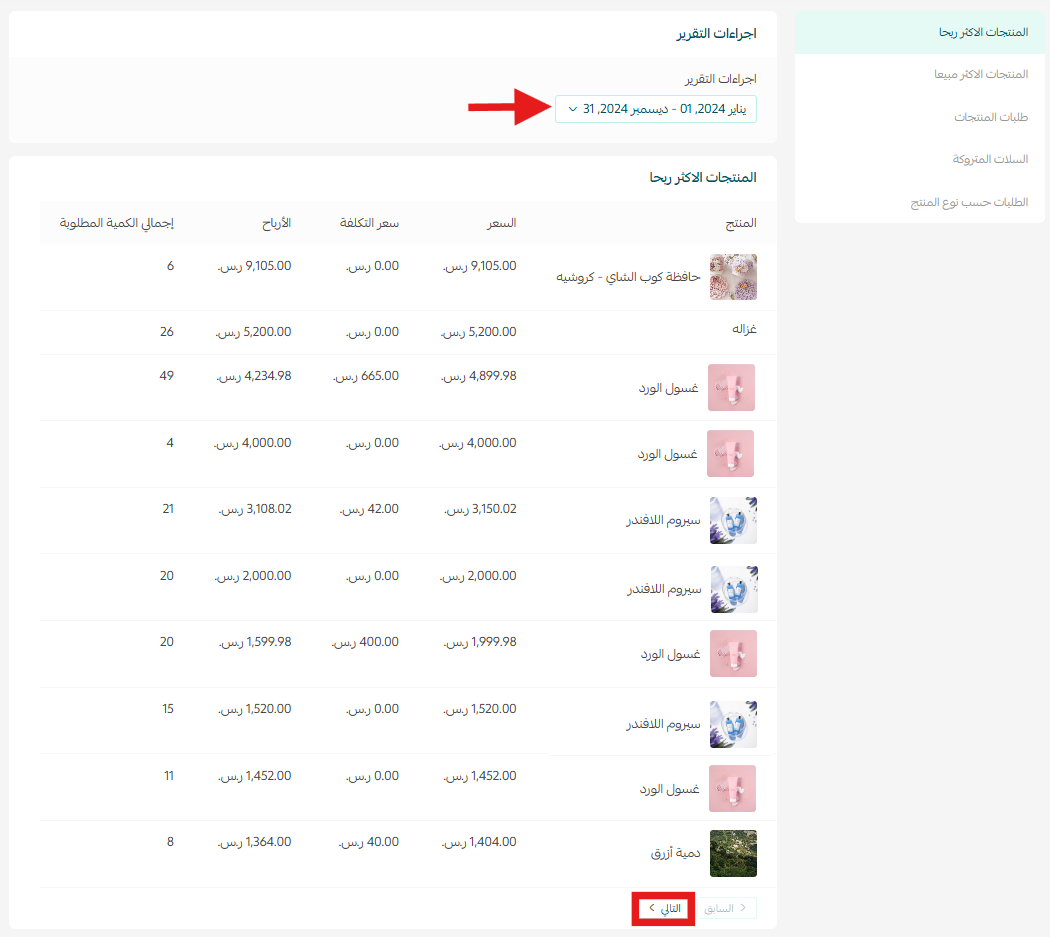
- Most Profitable Products
View products that generate the highest profit. Select Most profitable products, choose the time range, and review the results.
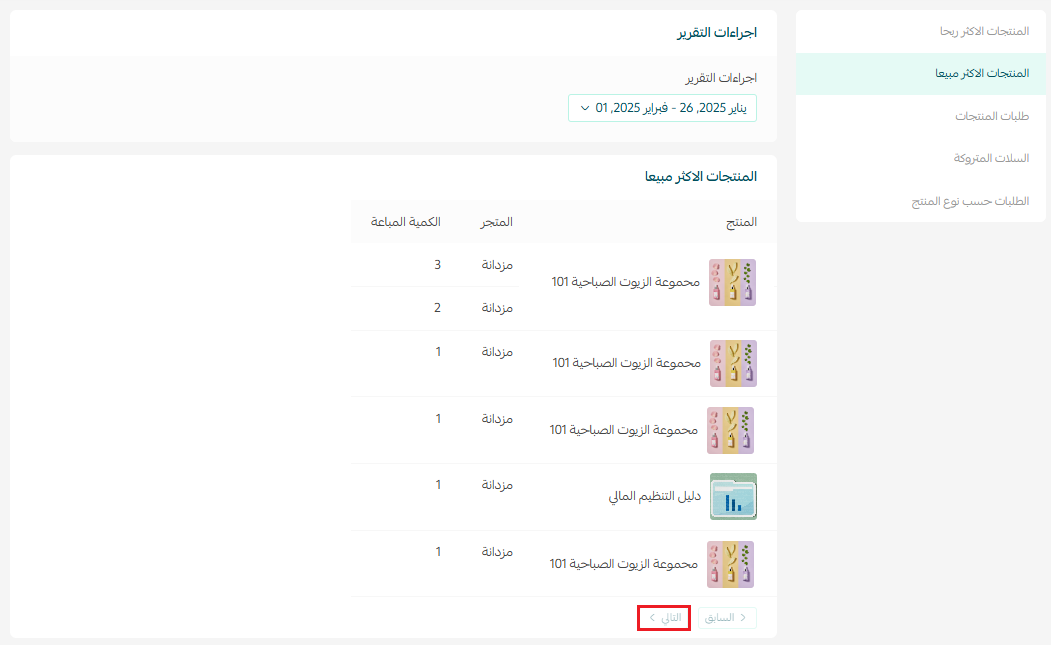
- Best Selling Products
Identify your top-selling products by selecting Top selling products and adjusting the date range.
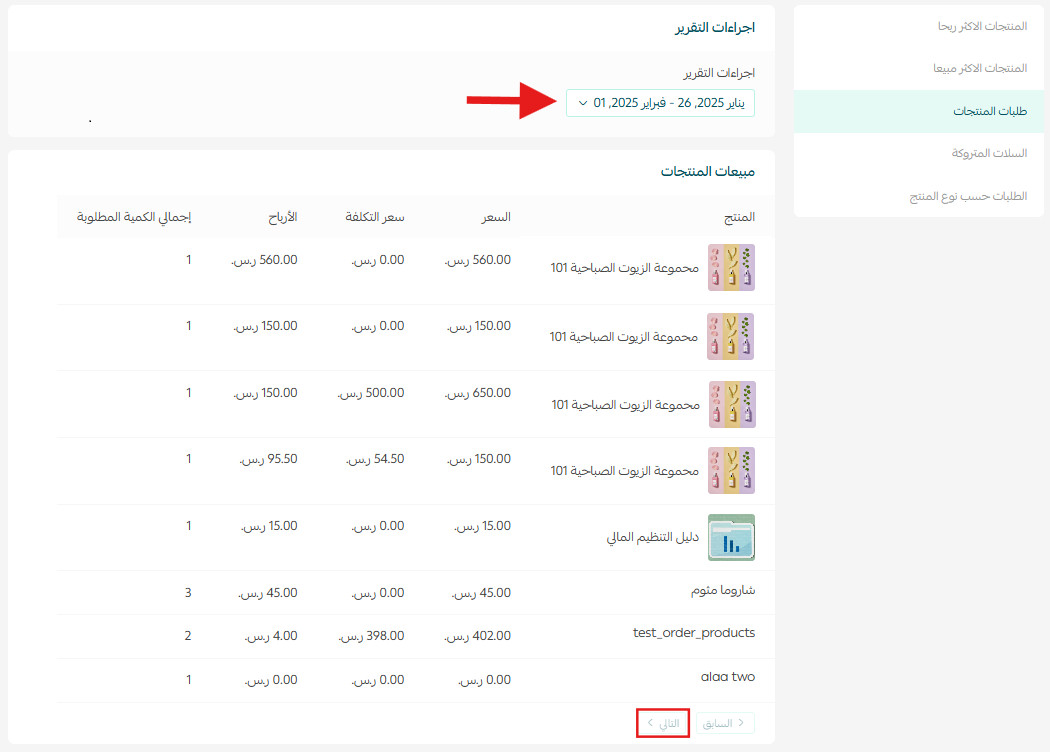
- Product Orders
View detailed reports on product orders.
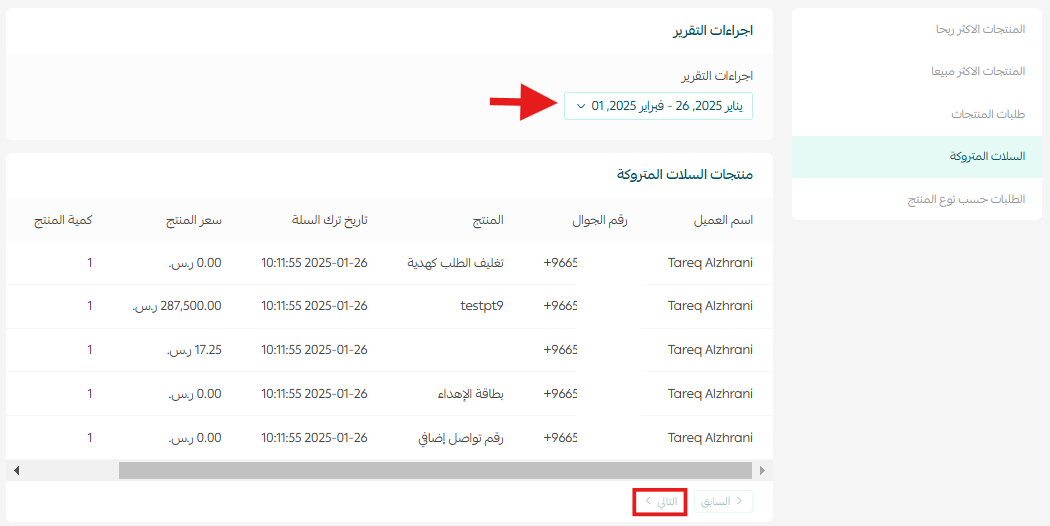
- Abandoned Carts
Analyze abandoned carts by selecting Abandoned Carts, choosing the time period, and reviewing the data.
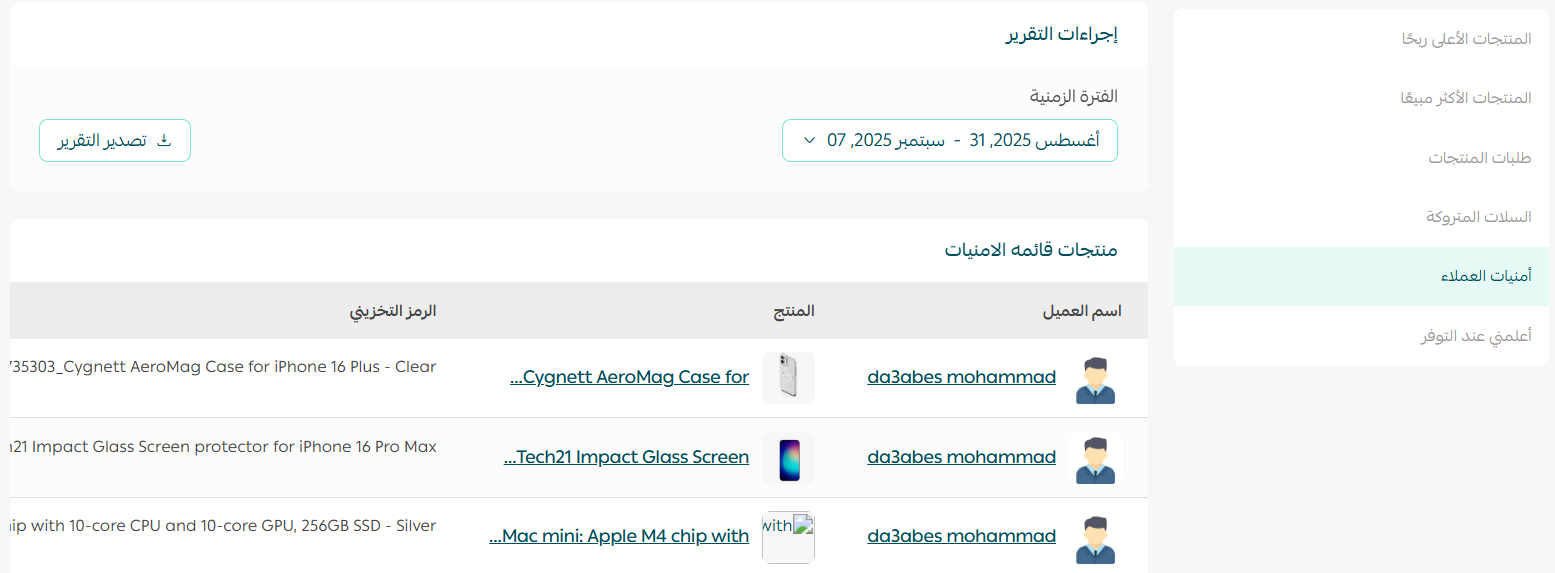
- Customer Wishlists
View customer wishlist activity by selecting Wishlists and setting the date range.
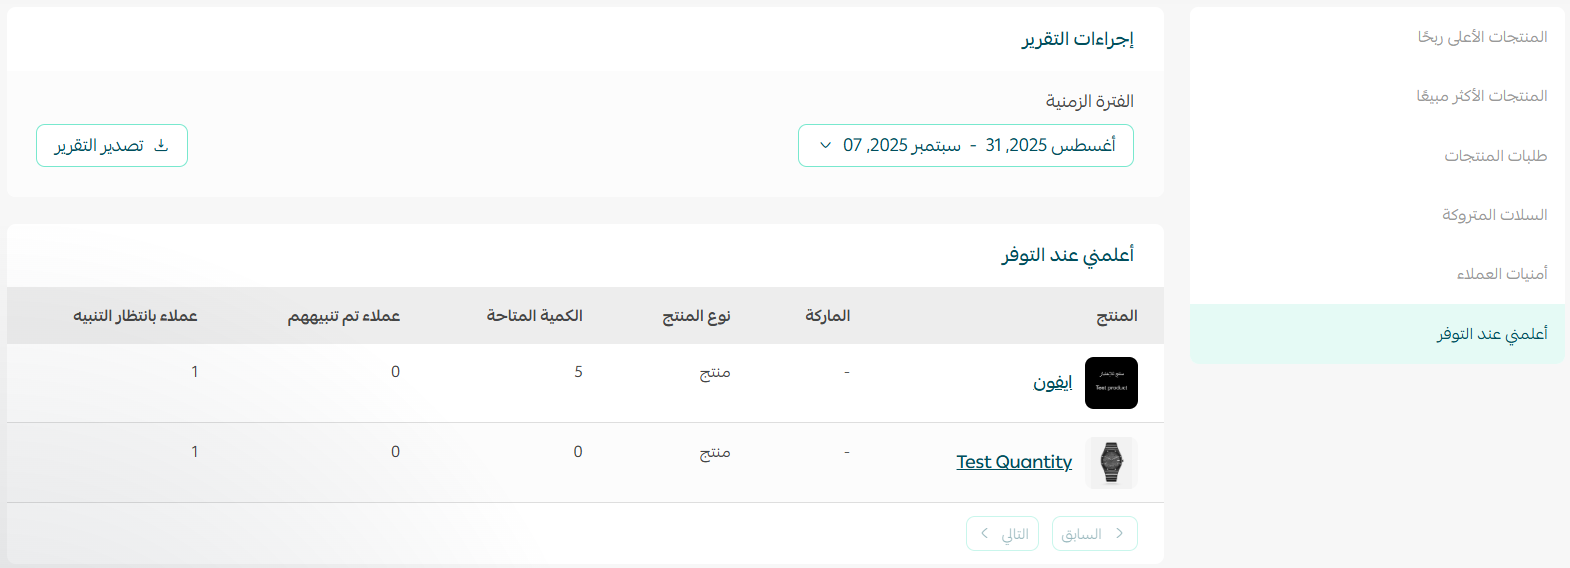
- Notify Me When Available
Track demand for out-of-stock products by selecting Back in stock alerts and adjusting the time period.
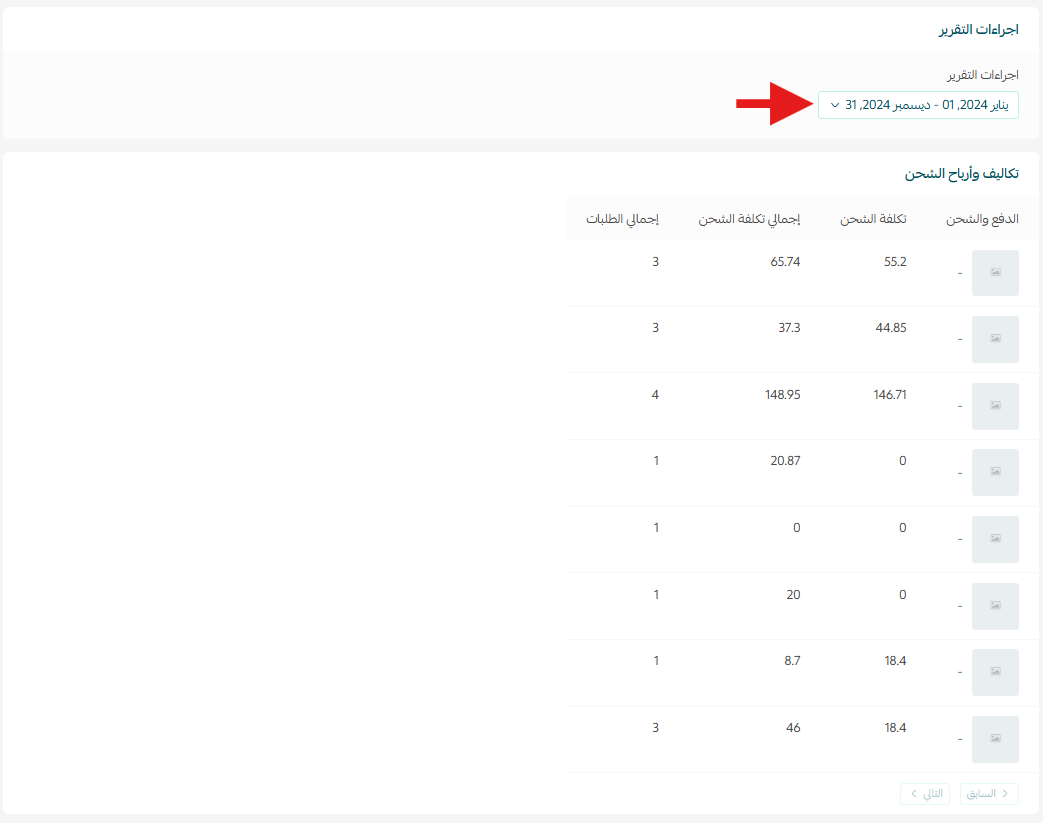
3. Payment and Shipping Reports
Payment and shipping reports provide insight into payment methods, shipping companies, costs, and profitability. These reports help you analyze checkout and delivery performance and improve the overall customer experience.
To view these reports, select Shipping carriers and choose the desired date range.
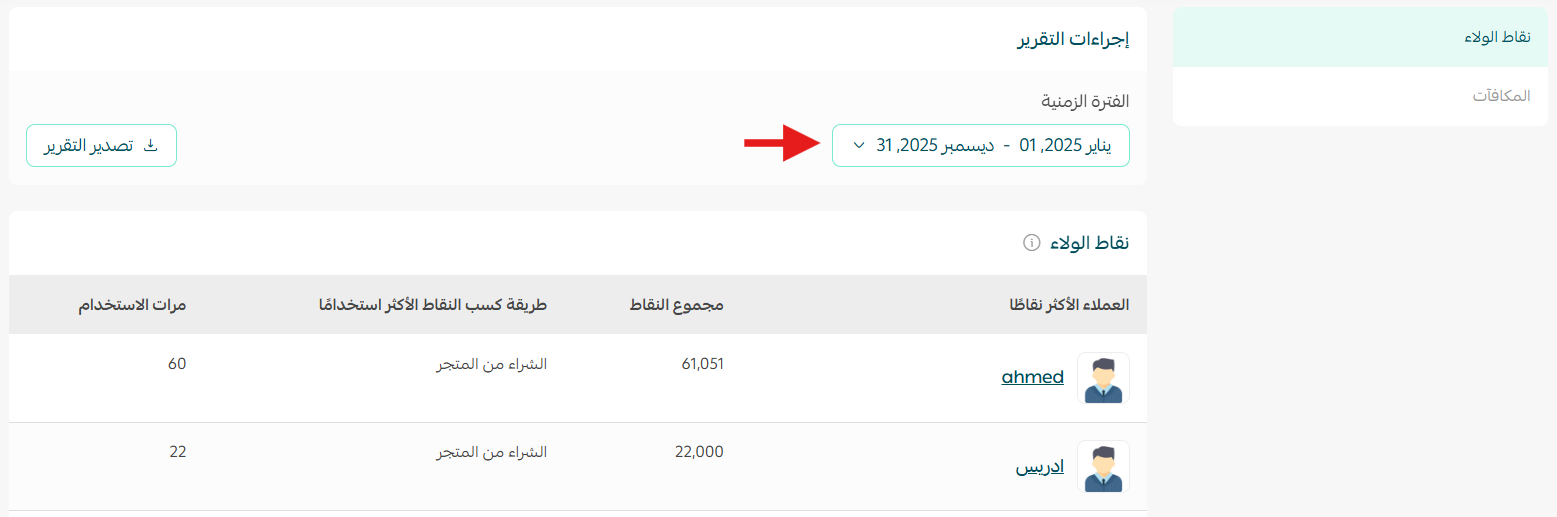
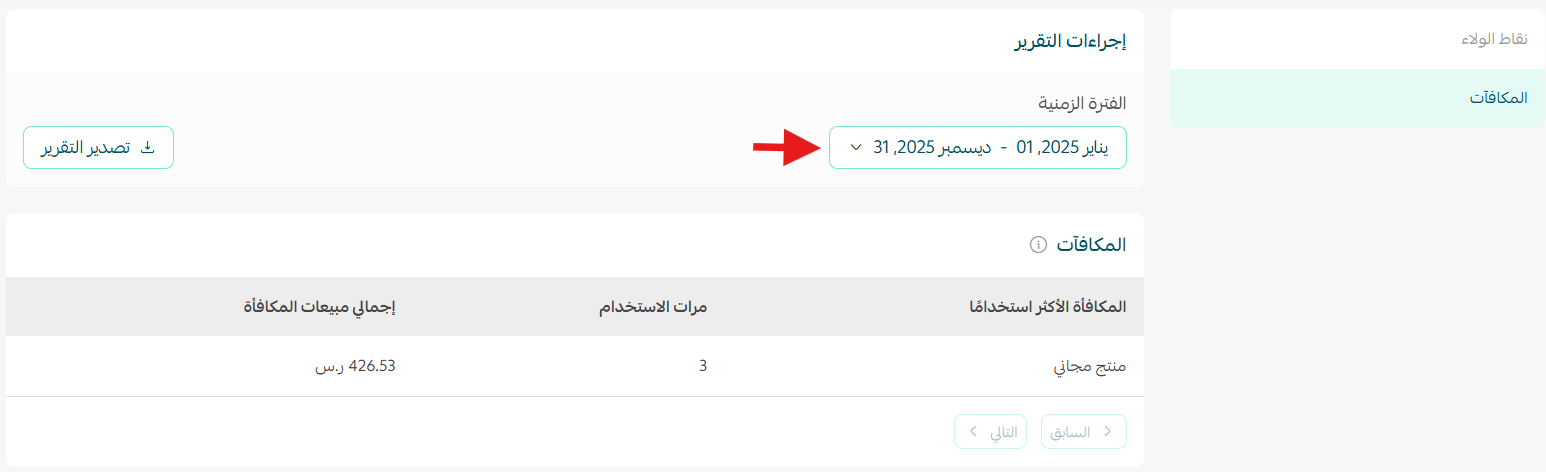
4. Loyalty System Reports
Loyalty system reports allow you to track loyalty activities and customer engagement.
- Loyalty Points Report
Monitor earned and redeemed loyalty points by selecting Loyalty Points Report and setting the date range.
- Rewards Report
Track reward activity by selecting Rewards and choosing the time period.
The Store Reports section gives you clear visibility into every part of your store performance. With organized data and flexible filtering, you can make faster decisions, identify opportunities, and improve results with confidence.