The Store Performance Page brings all your most important store metrics into one place. Orders, visits, products, sales, and more are displayed through clear and easy to understand charts.
This page helps you truly understand how your store is performing. It gives you a complete view of sales, customers, traffic, and inventory so you can identify challenges, reduce losses, and make smarter decisions that drive sustainable growth.
If you want to grow with confidence, this page is where you start.
📌 Article overview
- Store Performance Page
- Store Performance Reports
- Practical use cases for getting more value from the Store Performance page
Store Performance Page
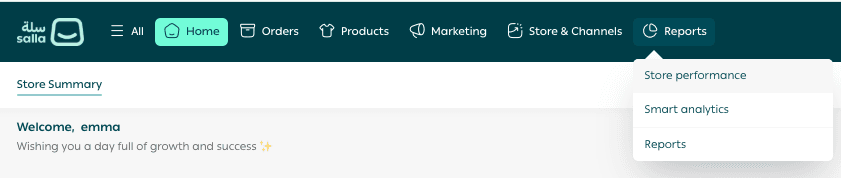
1. How to access the Store Performance Page
From the main store menu, go to Reports, then click Store Performance.
2. What the Store Performance Page includes
The Store Performance Page provides detailed reports across the following areas:
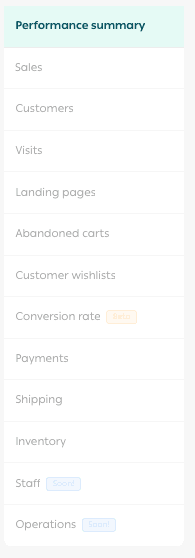
Each section focuses on a specific part of your business so you can analyze performance with clarity.
3. Customize your reports
Select the report you want to review, then choose the date range.
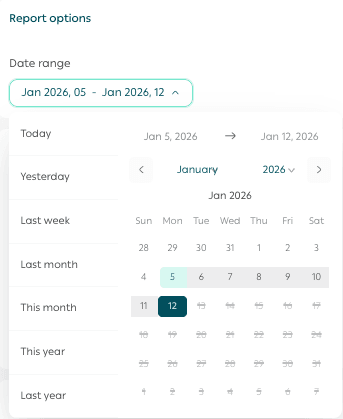
Your Store Performance report will appear instantly with visual insights that are easy to explore and act on.
Store Performance Reports
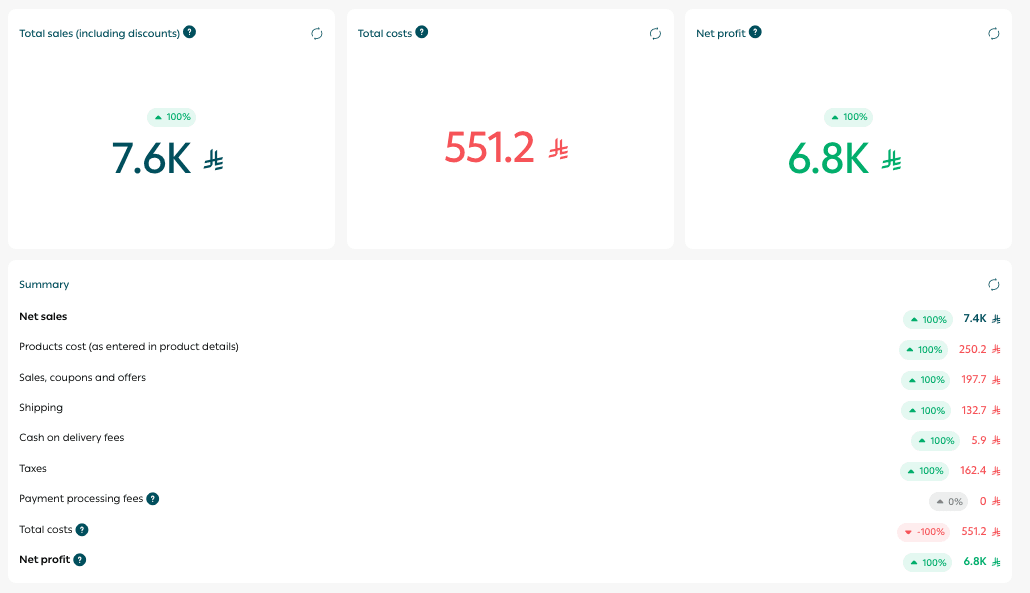
1. Store Performance Summary
🎯 A dynamic overview of your store that highlights total sales, total costs, and net profit.
This report helps you:
- Monitor overall store performance
- Track profitability over time
- Make strategic business decisions with confidence
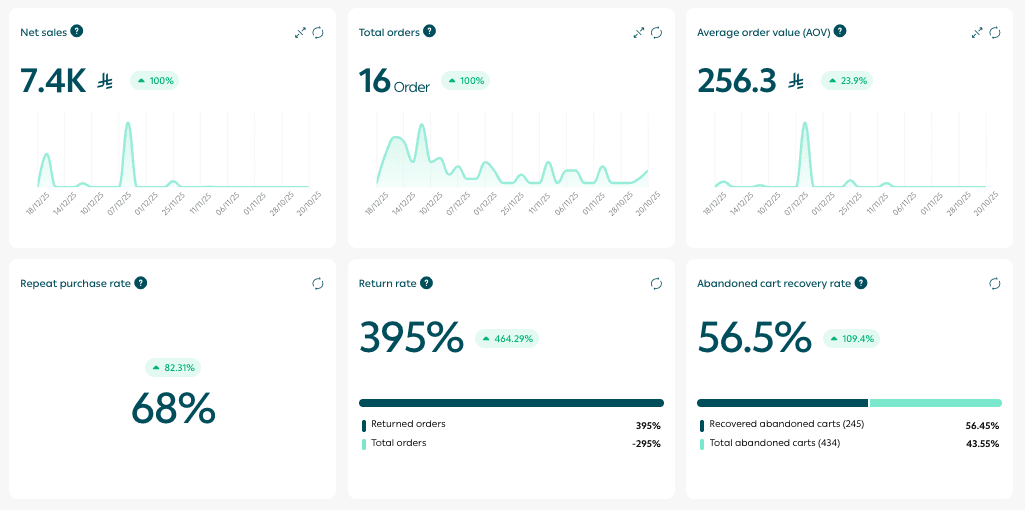
2. Sales Performance
🎯 A focused dashboard that shows how your sales are performing, including:
- Order volume
- Conversion rates
- Average order value
- Time based sales trends
- Best selling products
This report supports data driven decisions for sales and marketing growth.
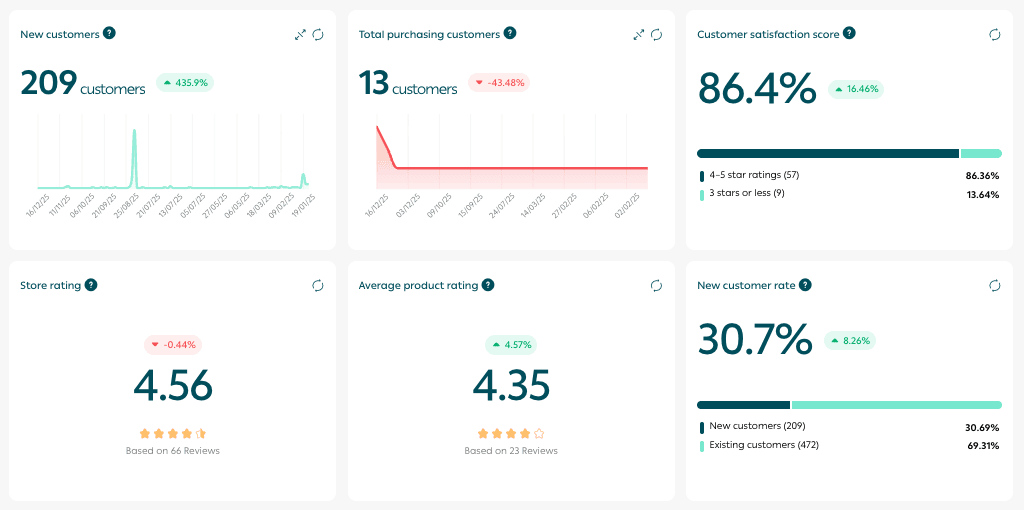
3. Customer Performance
🎯 A complete view of your customer base, including:
- Customer satisfaction indicators
- Repeat purchase rates
- Top customers
Understanding customer behavior through data helps you improve retention, increase satisfaction, and grow customer lifetime value.
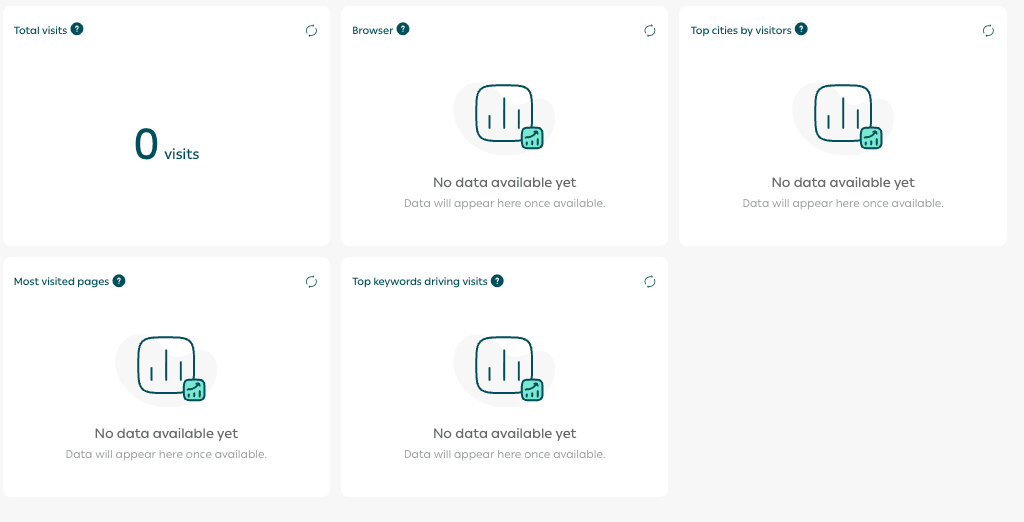
4. Visits
The Visits dashboard displays:
- Total visits
- Most used browsers
- Devices
- Most visited pages
- Search keywords
This report helps you optimize store content, reach the right audience, and increase engagement.
📝 Note: This feature requires connection to Google Analytics.
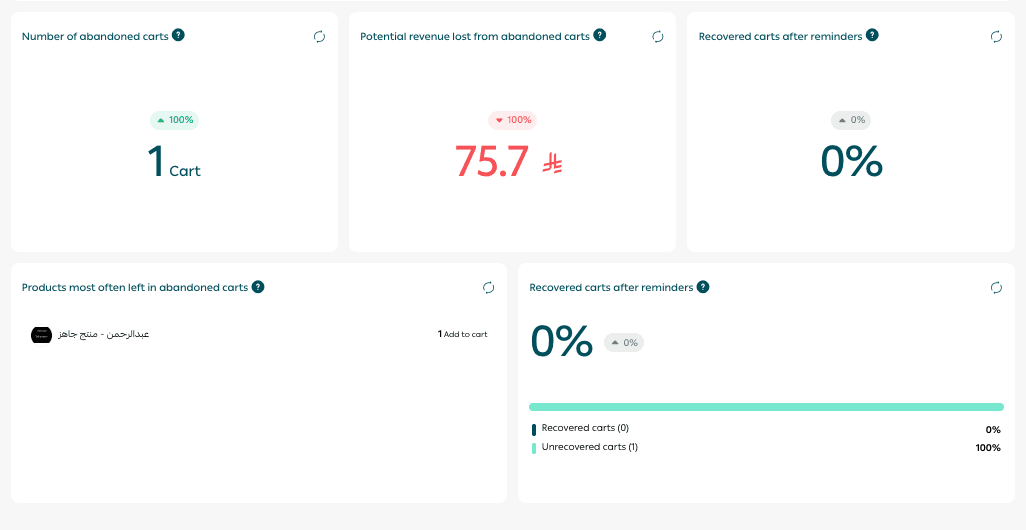
5. Abandoned Carts
🎯 A dashboard that highlights:
- Cart abandonment rates
- Estimated lost revenue
- Most frequently abandoned products
Many customers add products to their cart but do not complete checkout. This report helps you identify lost opportunities and improve conversions.
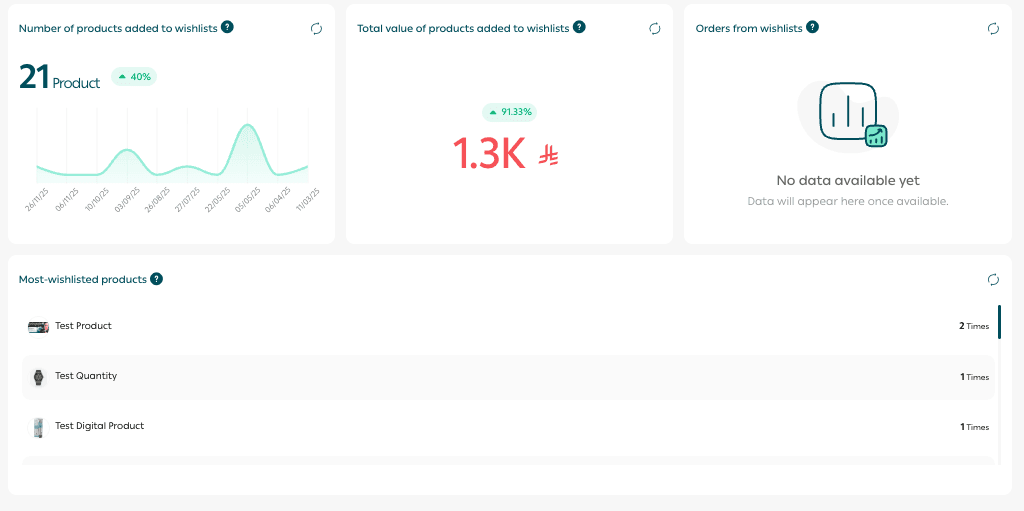
6. Customer Wishlists
The Wishlists section includes:
- Number of products added to wishlists
- Total value of wishlist items
- Purchase rate from wishlists
- Most added products
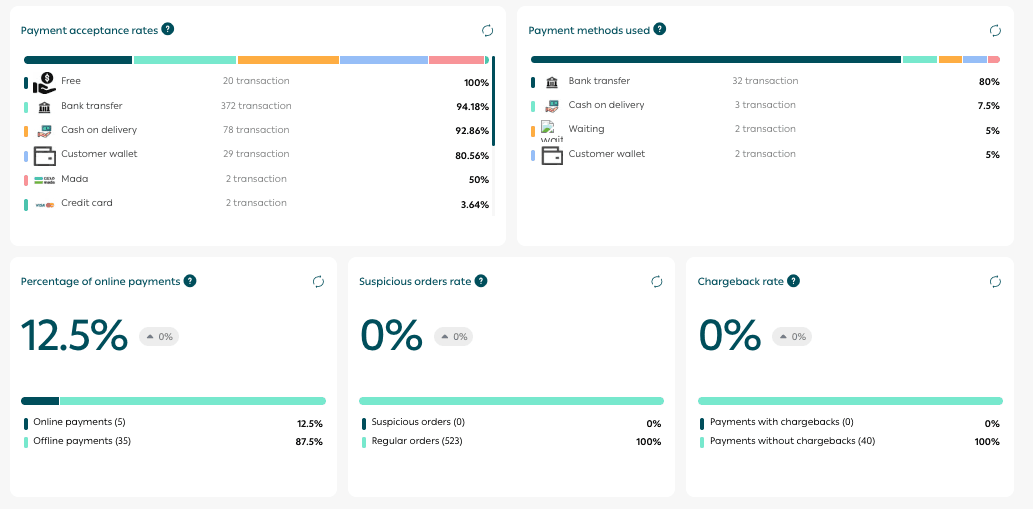
7. Payments
🎯 A payments dashboard that shows:
- Cost per payment method
- Payment acceptance rates
- Share of digital payments
- Refund activity
These insights help you optimize your payment strategy, reduce friction, and improve profit margins.
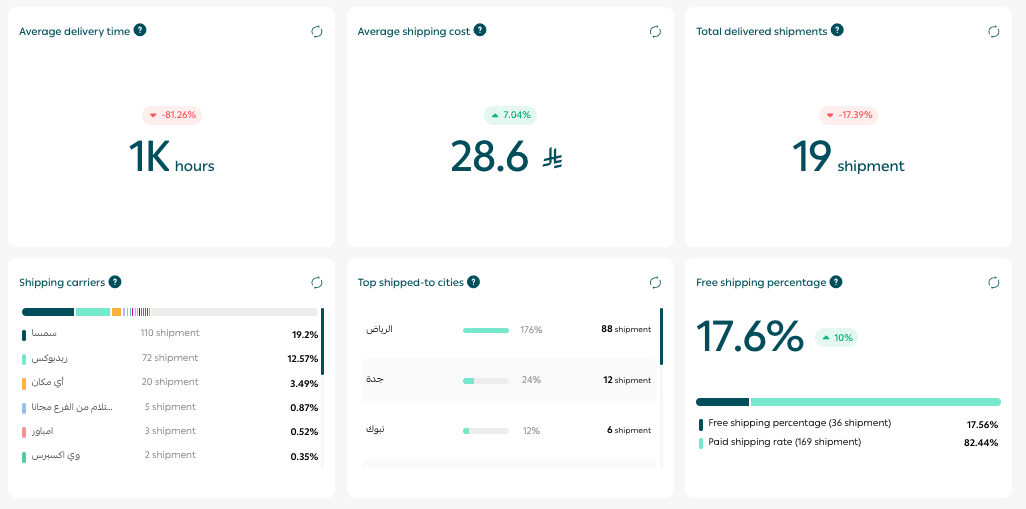
8. Shipping
A shipping performance dashboard that tracks:
- Shipping volume
- Shipping costs
- Delivery speed
- Share of free shipping
- Top shipping carriers
This report supports smarter logistics decisions and helps maintain a high delivery experience.
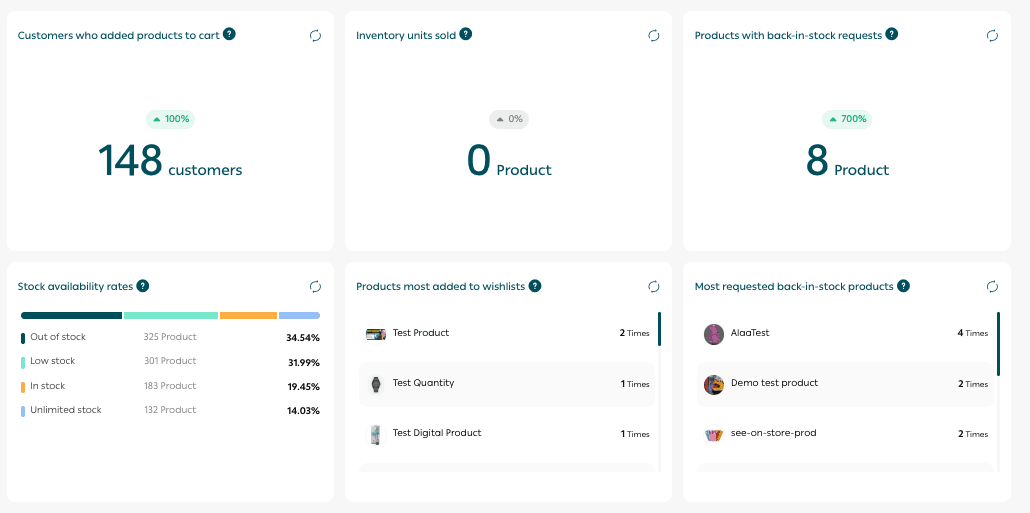
9. Inventory
🎯 An inventory dashboard that monitors:
- Stock levels
- Products requested when out of stock
- Most added products
This helps you prevent stock shortages, keep popular items available, and improve customer satisfaction.
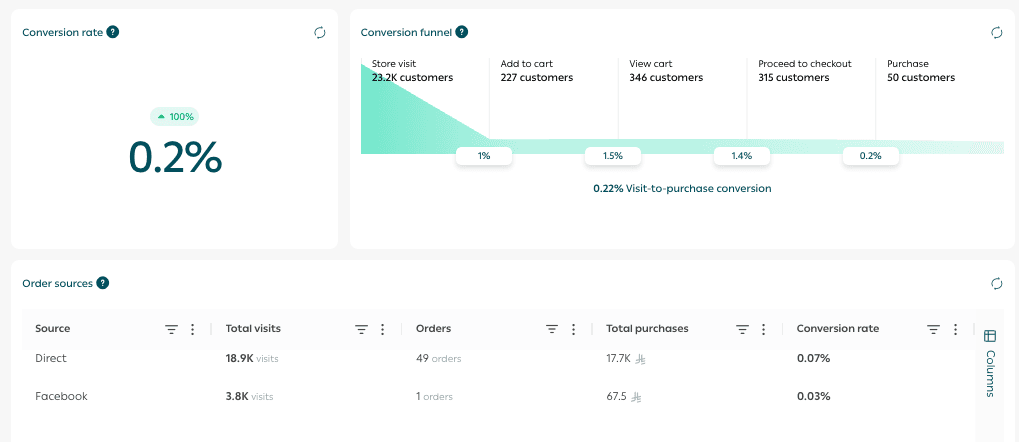
10. Conversion Rate
🎯 Measures how effective each step of the customer journey is, from the first visit to order completion.
This report helps you identify where customers drop off so you can improve performance at every stage.
11. Landing Page Analysis
The Landing Page Analysis feature allows you to track the performance of each landing page directly from the Store Performance Reports section.
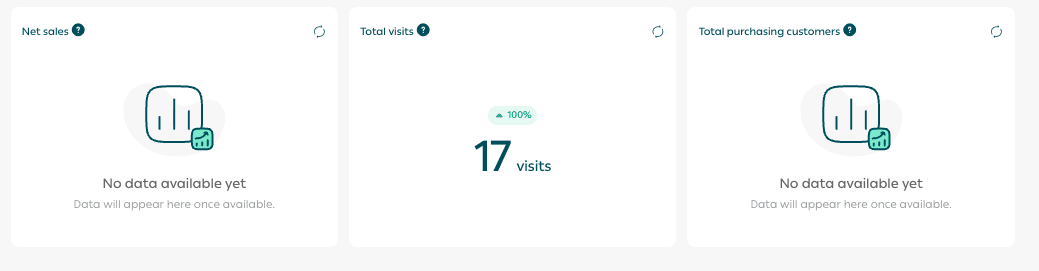
You can view:
- Total sales generated from the landing page
- Total customers who completed a purchase
- Total visits after connecting Google Analytics
- Performance comparison across selected time periods
🔔 Available for Pro and Special plans.
How to use Landing Page Analysis
- From the Store Performance Reports page, click Landing Pages.
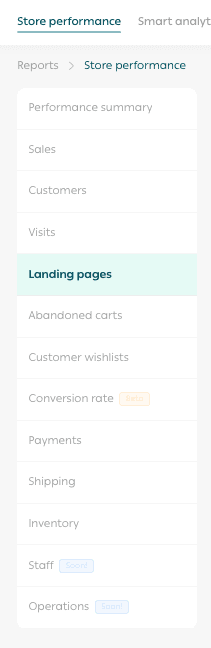
- Select a time range such as last 7 days, last 30 days, or a custom period and choose the landing page you want to analyze from the dropdown list.
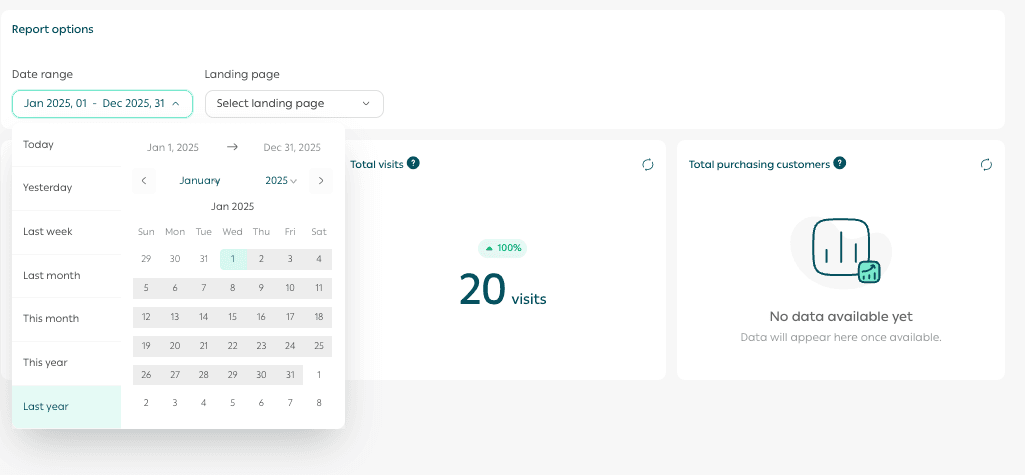
Key performance indicators including sales, visits, and customers will appear immediately.
Benefits of Landing Page Reports
- Clear visibility into landing page performance
- Better optimization of marketing campaigns using real data
- Identification of the most profitable pages
- Improved conversion rates and return on ad spend
Practical Ways to Use Store Performance Reports
1. Predict trending products before competitors
🔍 Use Sales Performance and Inventory reports to identify products with rising demand or increasing repeat purchases.
You can use this insight to:
- Prepare early promotions
- Increase inventory before demand spikes
2. Identify the best time to adjust prices or launch offers
⏳ Review peak hours, peak days, and Conversion Rate reports to learn when customers are most likely to buy.
During these periods, you can:
- Test small price adjustments
- Offer incentives such as free shipping or bundled products
This helps increase profit without reducing demand.
3. Personalize the shopping experience based on customer behavior
🎯 Use Customer Performance and Visits reports to segment customers by:
- New versus returning customers
- Device type
- Geographic location
Then create targeted campaigns such as:
- Mobile specific welcome offers
- Exclusive discounts for repeat customers
- Retargeting campaigns for visitors who did not complete checkout
4. Improve high traffic pages that do not convert
🔎 Use Most Visited Pages and Conversion Rate reports to identify pages that attract visitors but generate few purchases.
Improve these pages by:
- Enhancing product descriptions and images
- Adding reviews and customer testimonials
- Highlighting return policies or free shipping
- Recommending related products
5. Reduce abandoned carts with smart engagement
🛒 Use Abandoned Carts and Customer Performance reports to understand lost revenue opportunities.
You can then:
- Send reminder emails
- Offer limited time discounts
- Improve checkout experience or shipping options
6. Improve shipping and delivery to increase satisfaction
🚚 Review Shipping and Payments reports to identify shipping carriers or payment options that negatively impact customer experience.
Based on these insights:
- Reduce reliance on underperforming options
- Promote free or faster shipping during peak periods
- Assign premium carriers to specific customer groups
7. Optimize payment methods using performance data
💳 Use Payments and Conversion Rate reports to analyze acceptance rates and usage per payment method.
If a payment method performs well:
- Promote it as a preferred checkout option
- Improve or replace methods with low acceptance
8. Identify slow moving products and clear inventory strategically
📦 Use Inventory and Sales Performance reports to spot products with low movement.
You can clear stock by:
- Bundling with high performing products
- Running end of season offers
- Improving product presentation or positioning
9. Measure marketing campaign impact with confidence
📈 Use Visits and Conversion Rate reports to evaluate campaign performance by:
- Traffic source
- Visitor type
- Device
Focus your budget on the channels that deliver the highest return.
Final takeaway
The Store Performance Page is your trusted partner for making confident, data driven decisions.
It helps you understand your store, reduce operational and marketing risk, and build a competitive advantage through insight, clarity, and action.