Do you know how long your orders really take to reach your customers, and what each delivery costs you?
Shipping is where a good store either keeps a customer or loses one. It is also one of the largest costs you carry, and the easiest one to lose track of. The shipping reports in your Salla dashboard measure delivery time, shipping cost, delivered shipments, shipping company performance, your busiest cities, and how many orders used free shipping. In this guide, you'll learn how to open each shipping report, what every metric means and how it is calculated, and how to read the numbers together.
The shipping report shows the average shipping time and cost, the number of delivered shipments, the split of shipments across shipping companies, the cities you ship to most, and your free shipping rate. Detailed reports then break cost, revenue, and profit down for each shipping company.
📌 Article overview
- The general shipping report
- Detailed shipping reports
- Shipping company performance reports
- Practical examples for reading your shipping reports
- Frequently asked questions
👣 The general shipping report
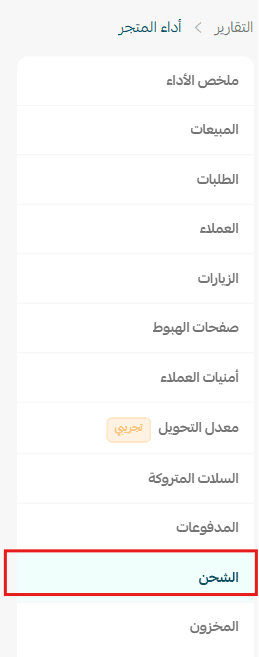
1. From your store's main menu, click (Reports), then click (Store performance).

2. Choose the report type (Shipping).
🎯 The shipping dashboard shows the key indicators tied to your shipping operations: average shipping time, average shipping cost, the number of delivered shipments, shipping company performance, the cities you ship to most, and the free shipping rate. Together they let you judge how efficient your delivery operation is and where the customer experience can improve.
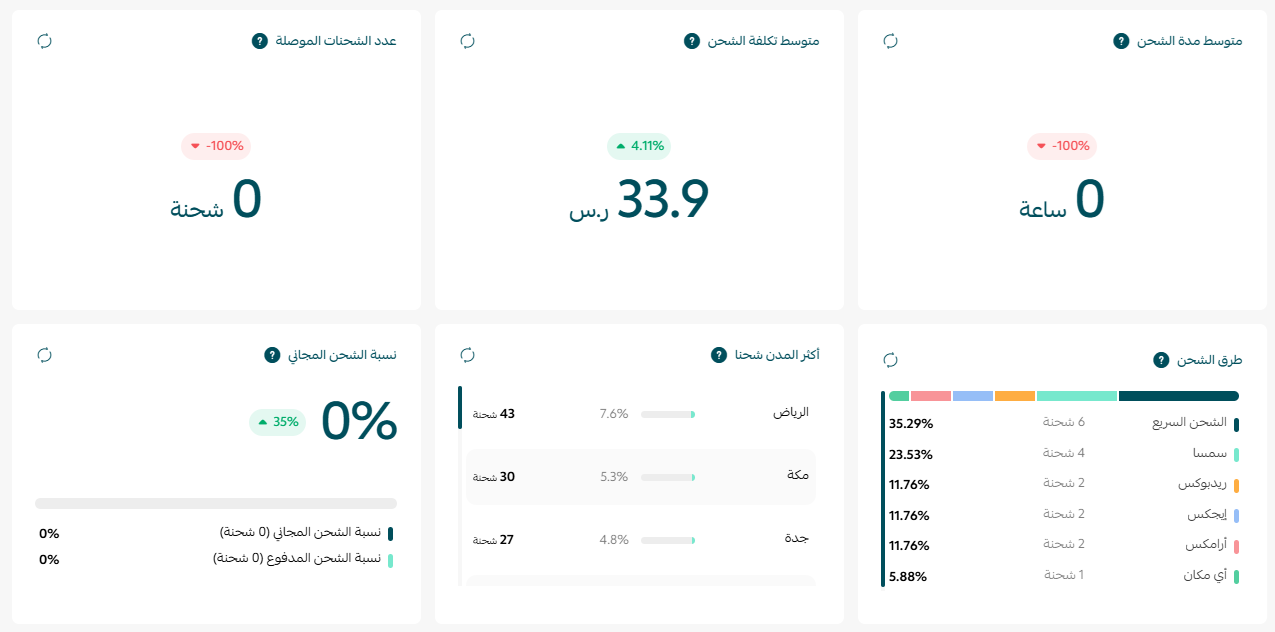
Average shipping time
What is it?
The average time from creating the shipment to delivering it to the customer.
How is it calculated?
Average shipping time = the average of (delivery time − shipment creation time) across all delivered shipments.
📝 Important notes
Only shipments with a valid shipping company, a tracking number, and a confirmed delivery date are counted.
Why it matters
It measures your delivery speed, lets you compare shipping companies against each other, and shows where the customer experience can be improved.
Average shipping cost
What is it?
The average amount your store pays shipping companies for each shipment.
Why it matters
It keeps your shipping costs visible, shows their effect on your store's profitability, and lets you compare what different shipping companies charge.
Number of delivered shipments
What is it?
The total number of orders delivered successfully to customers during the selected date range.
Why it matters
It tracks the volume of orders that actually reached customers, which is the clearest measure of your shipping throughput.
Shipping companies
What is it?
The split of shipments across shipping companies, with each company's share of your total shipments.
Why it matters
It shows which shipping companies you rely on most and lets you compare their performance before deciding who to ship with.
Top cities by shipments
What is it?
Cities ranked by the number of orders shipped to them.
Why it matters
It identifies your most active markets, so you can plan marketing campaigns or improve shipping options in those cities.
Free shipping rate
What is it?
The share of orders that used free shipping, compared with orders where the customer paid a shipping fee.
How is it calculated?
Free shipping = orders whose shipping cost is zero.
Paid shipping rate = (paid shipping orders ÷ total orders) × 100
📝 Important notes
[Verify: the source article gives the paid shipping formula under this metric. Free shipping orders are the remainder of total orders once paid shipping orders are removed.]
Why it matters
It shows what your free shipping policy is doing to sales, and lets you weigh its cost against the return it brings in.
🔍 Detailed shipping reports
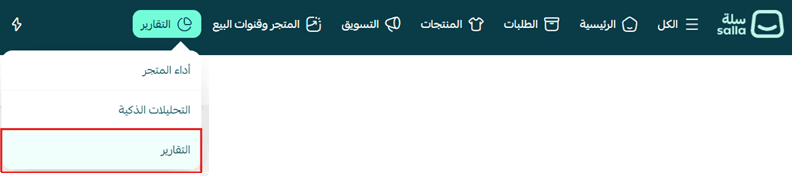
1. From the (Reports) tab in the main menu, click (Reports).
2. From the list of report types, choose (Shipping companies).
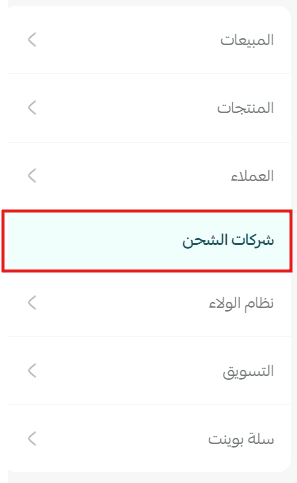
This report shows how every shipping company you work with performed, setting out the number of orders, the shipping cost, the shipping revenue collected from customers, and the shipping profit or loss for each company over the selected date range. It is what lets you compare companies and make decisions that cut costs and protect your margin.
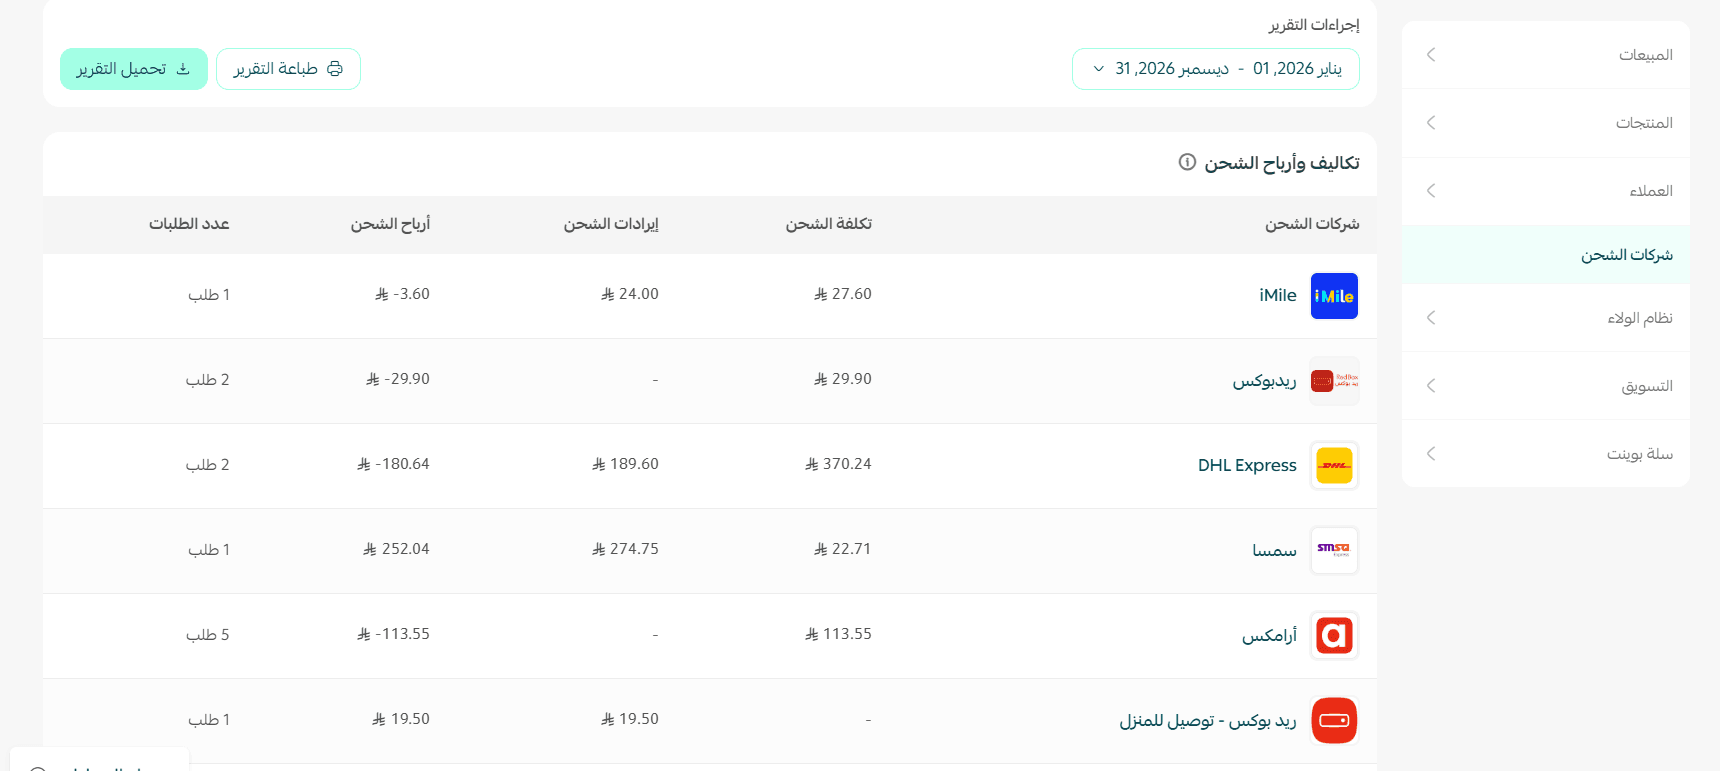
The report includes these metrics
- Shipping company: the name of the shipping company used to fulfill the orders.
- Shipping cost: the total amount paid to the shipping company.
- Shipping revenue: the total shipping fees paid by customers.
- Shipping profit: the difference between shipping revenue and shipping cost, which tells you whether your shipping fees cover their cost or turn a profit.
- Number of orders: the number of orders shipped through each company.
This report helps you
- Compare shipping companies on cost and profitability.
- Find the companies that strike the best balance between shipping cost and shipping revenue.
- Spot the companies causing repeated losses because their shipping cost runs high.
- Decide whether to switch shipping company or reprice the shipping fees you charge customers.
🎯 Shipping company performance reports
If you want to analyze shipping company performance in more depth, click the (View reports) button at the bottom of the shipping reports page.

This section gives you analytical indicators for judging how efficient your shipping companies are, comparing them against each other, measuring customer satisfaction, and breaking down your logistics costs so your decisions rest on real numbers.
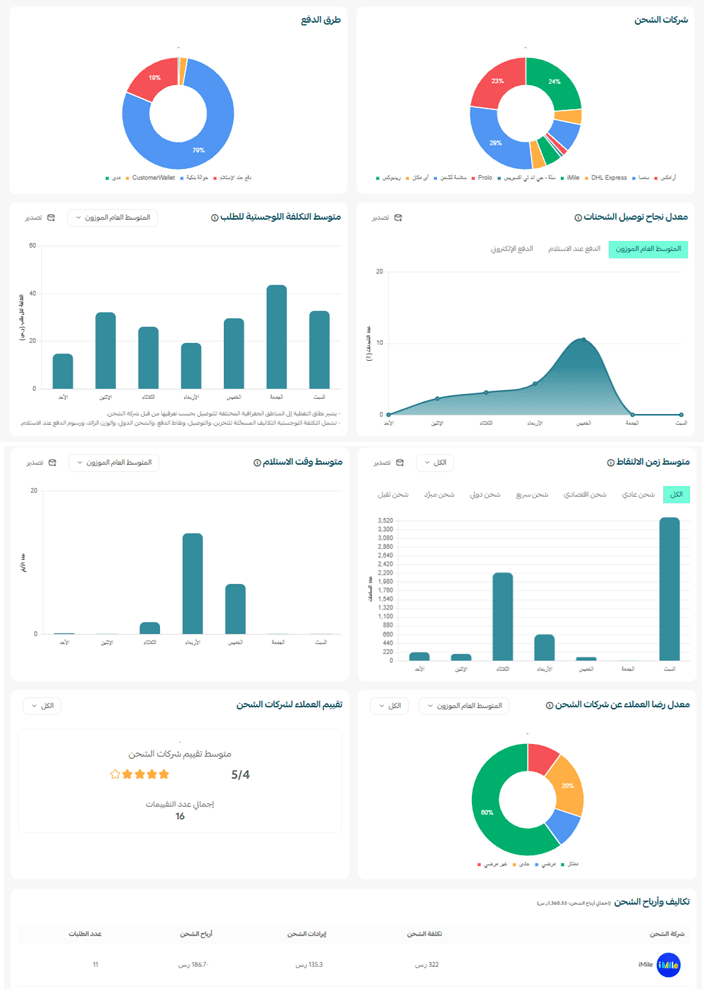
It includes the following reports:
Shipping companies
Shows how orders are distributed across your shipping companies as a chart, so you can see each company's share of total shipments.
Why it matters
It tells you which companies you lean on most, and lets you set that usage against their actual performance on delivery speed, cost, and customer satisfaction.
Payment methods
Shows how orders are distributed across the payment methods customers used, such as online payment, cash on delivery, and wallet, with each method's share of total orders.
Why it matters
It tells you which payment methods your customers prefer, and how each one affects shipping and delivery, particularly when you compare online-paid orders against cash on delivery.
Shipment delivery success rate
Shows the percentage of shipments delivered successfully for each shipping company, with the option to compare performance by payment method (online payment or cash on delivery).
Why it matters
It identifies the shipping companies that get orders delivered, so you can cut failed deliveries and reshipments.
Average logistics cost per order
Shows the average logistics cost of each order, with the option to compare shipping companies.
Logistics cost includes:
- Storage.
- Delivery.
- Pickup points.
- International shipping.
- Excess weight fees.
- Cash on delivery fees.
Why it matters
It shows the true cost of every order, and pinpoints the companies or services eating the largest share of your margin.
Average pickup time
Shows the average time a shipping company takes to collect the shipment after the order is created. You can also view it by shipping type:
- Standard shipping.
- Economy shipping.
- Express shipping.
- International shipping.
- Refrigerated shipping.
- Heavy shipping.
You can also narrow the view to a single shipping company using the filter.
Why it matters
The shorter the pickup time, the sooner the delivery journey begins, and the faster the order reaches the customer.
Average time to receipt
Shows the average time from creating the shipment until the customer receives their order.
Why it matters
It lets you compare shipping companies on speed and pick the one that gives your customers the best delivery experience.
Customer satisfaction with shipping companies
Shows how satisfied customers were with the shipping experience for each company, along with the average rating and the total number of ratings.
Why it matters
It shows the effect each shipping company has on the customer experience, not just on delivery speed or cost.
Shipping costs and profits
Gives a detailed comparison between shipping companies on:
- Shipping cost.
- Shipping revenue.
- Shipping profit or loss.
- Number of orders fulfilled by each company.
Why it matters
It shows which companies deliver the best return and which cost more than they bring in, so you can rework your shipping policy, negotiate better rates, or move shipments between companies.
💡 Practical examples for reading your shipping reports
Example 1: average shipping time went up
Example:
Last month: two days.
This month: four days.
What does it mean?
Orders are taking longer to reach customers, which can hurt satisfaction.
What can you do?
- Review your shipping companies' performance.
- Make sure orders are prepared quickly before they are handed to the shipping company.
- Watch the cities where delays keep repeating.
Example 2: average shipping cost went up
Example:
Last month: SAR 18 per shipment.
This month: SAR 28 per shipment.
What does it mean?
Delivering orders now costs more, which eats into your margin.
What can you do?
- Compare shipping company rates.
- Review your free shipping policy.
- Negotiate better rates with your shipping company.
Example 3: delivered shipments went down
Example:
Last month: 1,200 shipments.
This month: 900 shipments.
What does it mean?
Fewer orders reached customers. The cause could be lower sales or a delay somewhere in delivery.
What can you do?
- Check your sales and orders reports.
- Confirm there are no orders stuck in preparation or shipping.
Example 4: one shipping company handles most of your shipments
Example:
80% of shipments went through a single shipping company.
What does it mean?
Your store depends heavily on one shipping company.
What can you do?
- Monitor that company's performance continuously.
- Try adding other shipping companies to reduce your risk and widen customer choice.
Example 5: one city accounts for the most shipments
Example:
35% of shipments were delivered to Riyadh.
What does it mean?
That city represents a large share of your store's orders.
What can you do?
- Target that city with dedicated marketing campaigns.
- Improve the shipping options and delivery speed available there.
Example 6: the free shipping rate went up
Example:
Last month: 25% of orders.
This month: 60% of orders.
What does it mean?
More customers used free shipping, which could be the result of a marketing campaign or a change to your shipping policy.
What can you do?
- Compare the cost of free shipping against the increase in sales.
- Confirm the offer returns enough to cover what it costs.
- Test a minimum order value for free shipping if you need to.
Example 7: one shipping company keeps losing money
Example:
Company A:
Shipping cost: SAR 8,500.
Shipping revenue: SAR 6,900.
Shipping profit: SAR -1,600.
What does it mean?
The shipping fees your customers pay do not cover what shipping actually costs, and your store's profit is absorbing the difference.
What can you do?
- Review this company's shipping rates.
- Negotiate better rates with the shipping company.
- Update the shipping fees in your store if you need to.
Example 8: order volume is high but shipping profit is low
Example:
A shipping company fulfilled 500 orders, but shipping profit came to only SAR 200.
What does it mean?
Despite the volume, your shipping margin is very thin, and the fees you charge customers may be below the real cost.
What can you do?
- Review how you price shipping.
- Compare this company's cost against the alternatives.
- Watch what any change does to customer satisfaction and sales.
Example 9: the share of cash on delivery is rising
Example:
The report shows that 70% of orders are paid by cash on delivery.
What does it mean?
Most of your customers rely on cash on delivery, which can raise refused deliveries and reshipments, and push your logistics costs up.
What can you do?
- Encourage online payment by offering discounts or loyalty points.
- Track the delivery success rate for each payment method.
- Compare shipping cost between online-paid orders and cash on delivery orders before you decide what to change.
💡 Tip: Never judge shipping on a single indicator. Delivered shipments can rise at the same time as shipping time or shipping cost. Read average shipping time, average shipping cost, and shipping company performance together to get the full picture, improve the delivery experience, and bring costs down.
❓ Frequently asked questions
Where do I find the shipping reports?
For the general shipping report, click (Reports) in your store's main menu, then (Store performance), and choose the report type (Shipping). For the detailed reports, click (Reports) in the main menu, then (Reports), and choose (Shipping companies).
Why is a shipment missing from the average shipping time?
Only shipments that have a valid shipping company, a tracking number, and a confirmed delivery date are counted. Anything missing one of those three is left out.
How is shipping profit calculated?
Shipping profit is the difference between shipping revenue, which is the shipping fees your customers paid, and shipping cost, which is what you paid the shipping company. A negative figure means your fees do not cover the cost.
What is included in the logistics cost per order?
Storage, delivery, pickup points, international shipping, excess weight fees, and cash on delivery fees.
What is the difference between average pickup time and average time to receipt?
Average pickup time measures how long the shipping company takes to collect the shipment after the order is created. Average time to receipt covers the whole journey, from creating the shipment until the customer receives the order.
🔥 Review your shipping reports regularly to measure delivery speed, keep shipping costs in check, judge your shipping companies on results, and improve the experience your customers get, so satisfaction rises and your shipping operation runs more efficiently. 🚀