Your sales went up last month — do you know which part of the store actually moved?
Sales reports let you follow how your store performs and analyze results over a period you choose, so decisions come from data rather than instinct: which products sell best, how categories perform, whether your offers and coupons earn their keep. In this guide, you'll learn where to find your sales reports in Salla, what every metric means and how it is calculated, and how to read the numbers when they move.
Salla splits sales reporting in two. The general sales report lives under Reports, then Store performance, where you pick Sales as the report type. The detailed sales reports live under Reports, then Reports, where you choose a specific report such as product sales, category sales, city sales or coupon sales.
📌 Article overview
- The general sales report and every metric in it
- The detailed sales reports
- Worked examples for reading your sales reports
- Frequently asked questions
🎯 The general sales report
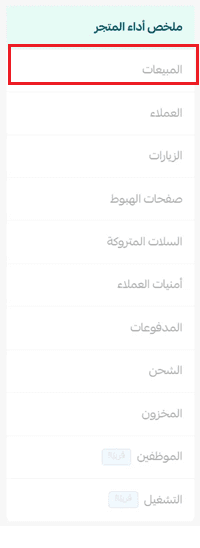
1. From your store's main menu, click (Reports), then click (Store performance).

2. Choose (Sales) as the report type.
🎯 The sales dashboard shows headline sales performance, order volumes, conversion rates, average order values, time-based trends and best-selling products, and it points your sales and marketing decisions at the data.
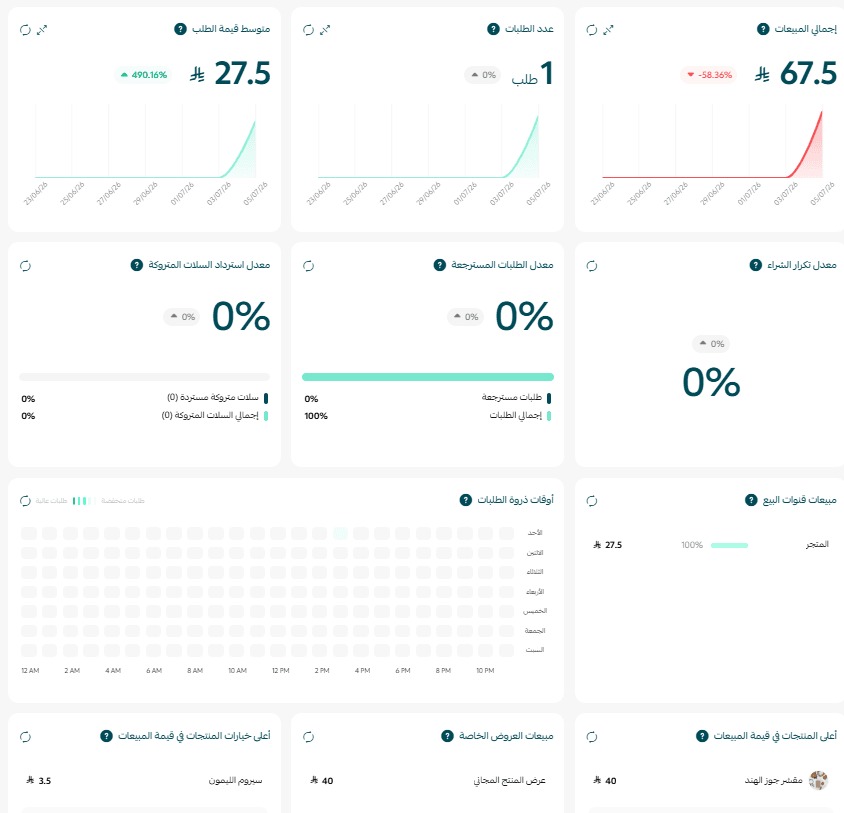
Total sales
The total value of sales before discounts are applied. It includes products, shipping and taxes, and it does not include returns.
Number of orders
The total number of orders placed in the selected period.
- How is it calculated?
Number of orders = the count of all orders with the selected statuses within the time period
- Why it matters
It tells you whether growth in sales came from more orders or from a higher value per order.
Average order value
The average amount a customer spends per order. Raising it means more revenue without having to bring in new customers.
- How is it calculated?
Average order value = total order value ÷ number of orders
💡 Note: order value includes taxes and shipping.
Repeat purchase rate
The share of orders that come from customers who have bought from your store before. The higher it goes, the more it points to satisfied, loyal customers.
- How is it calculated?
Repeat purchase rate = (total orders − number of unique customers) ÷ total orders
💡 Example: if you have 100 orders from 70 different customers, 30 of those orders came from returning customers, so the repeat purchase rate is 30%.
Return rate
The share of orders that customers sent back.
- How is it calculated?
Return rate = (returned orders ÷ total orders) × 100
Abandoned cart recovery rate
Out of the abandoned-cart reminders sent to customers, the share that ended in a purchase.
- How is it calculated?
Recovery rate = (recovered carts ÷ total abandoned carts) × 100
💡 Note: this figure only covers carts from the last 60 days.
Sales channel breakdown
Sales split by the channel the order came from: the website, the app, Instagram and so on.
- Metrics calculated
- Each channel's share of total sales
- Each channel's share of total orders
Peak order times
A heat map showing which days and hours take the most orders.
- Why it matters
It helps you pick the best moments to launch offers and to plan your working schedule.
- How is it calculated?
The number of orders for each day-and-hour combination during the selected period
Top products by sales value
Products ranked from highest to lowest by their total sales value.
- How is it calculated?
Product sales = (gross sales − discounts + taxes), converted to the store currency
- Shown for each product: quantity sold, total cost, gross sales, discounts, taxes.
Promotion sales
How each coupon or promotion performed, and how much discount it handed out.
- How is it calculated?
Total coupon discount = the sum of (product discounts + shipping discounts) across all orders that used the coupon
📝 Note: if the same coupon was applied more than once to a single order, it counts only once, so nothing is double-counted.
Best-selling product options (options and variants)
The best-selling product variants, such as size L or the color red, ranked by quantity sold.
Category sales
Total sales grouped by product category, from highest to lowest.
- How is it calculated?
Category sales = the sum of (gross sales − discounts) for every product in that category
Brand sales
Total sales grouped by brand, from highest to lowest.
🔍 Detailed sales reports
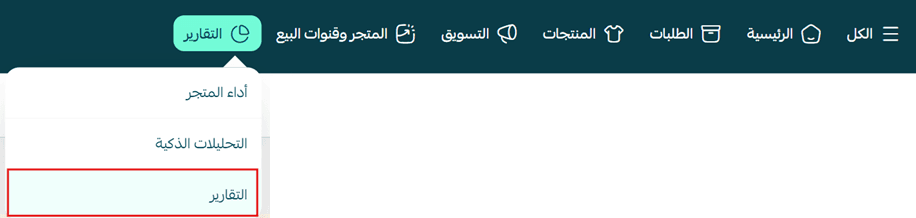
1. From the (Reports) tab in the main menu, click (Reports).
2. From the list of report types, pick the report you want to view, such as (Product sales).
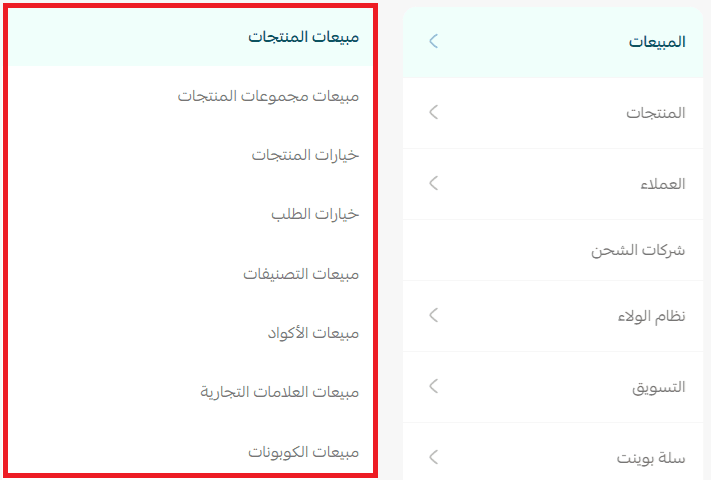
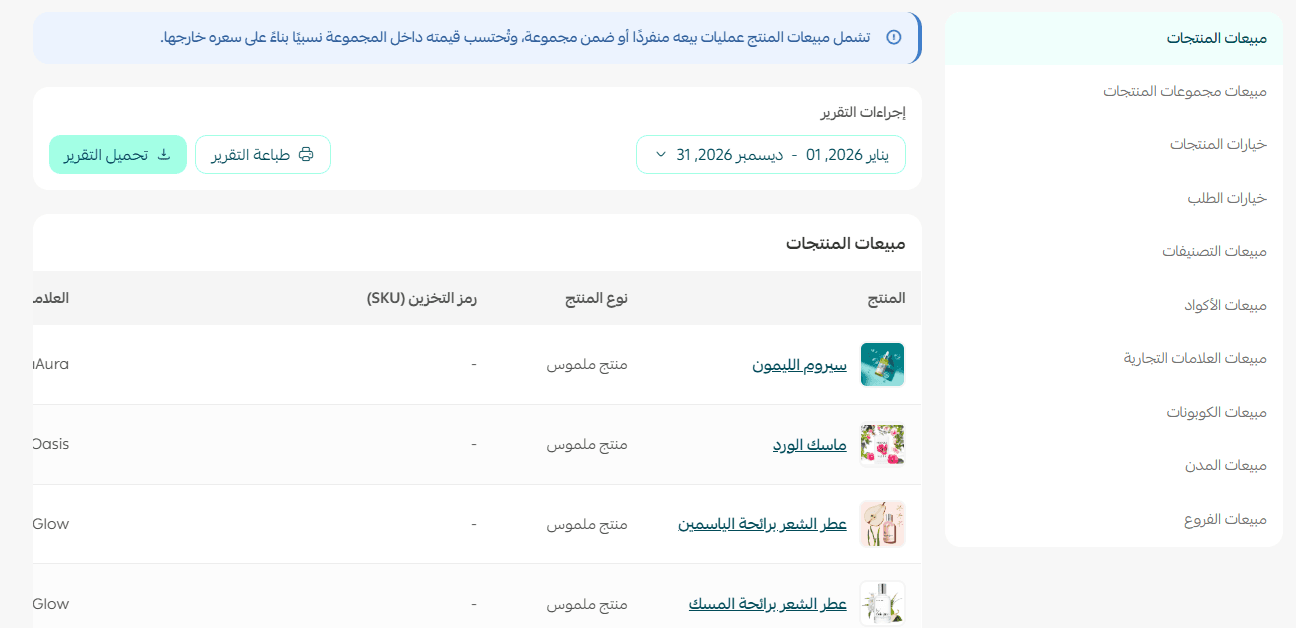
Product sales
Shows how your products performed and what each one sold during the selected period, so you can see the best and worst sellers.
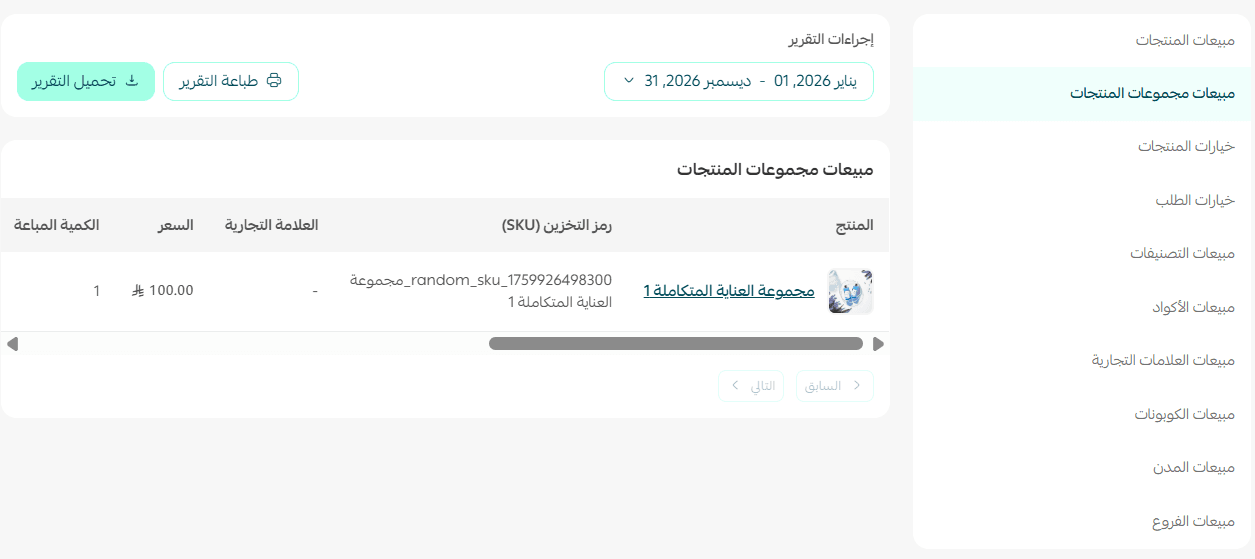
Product group sales
Shows how each product group performed and the sales it generated.
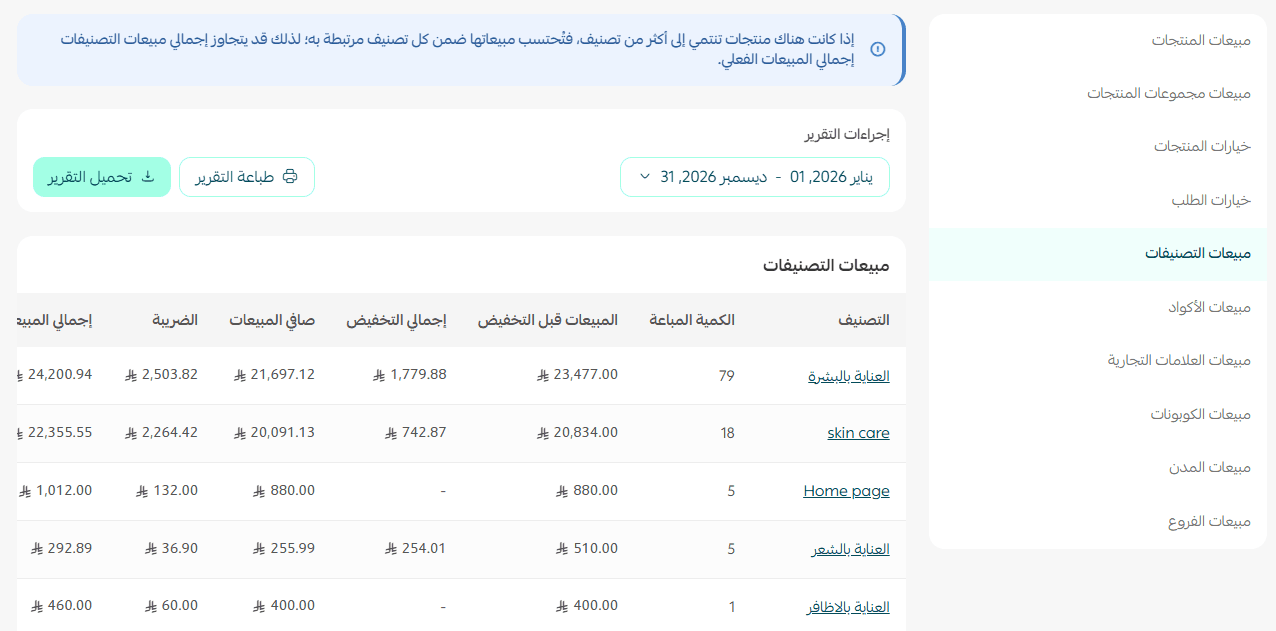
Category sales
Shows how your different categories performed, so you can see which ones bring in the most sales.
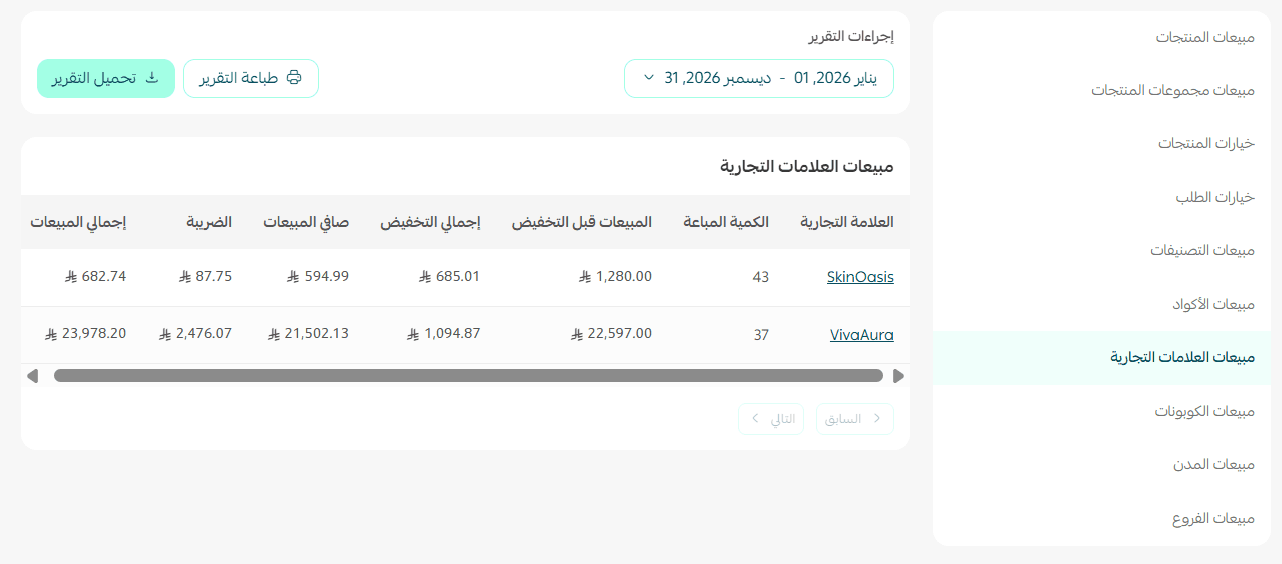
Brand sales
Shows how the brands in your store performed and what each brand sold.
Product option sales
Shows how your different product options performed, such as color, size, or any other option you have added.
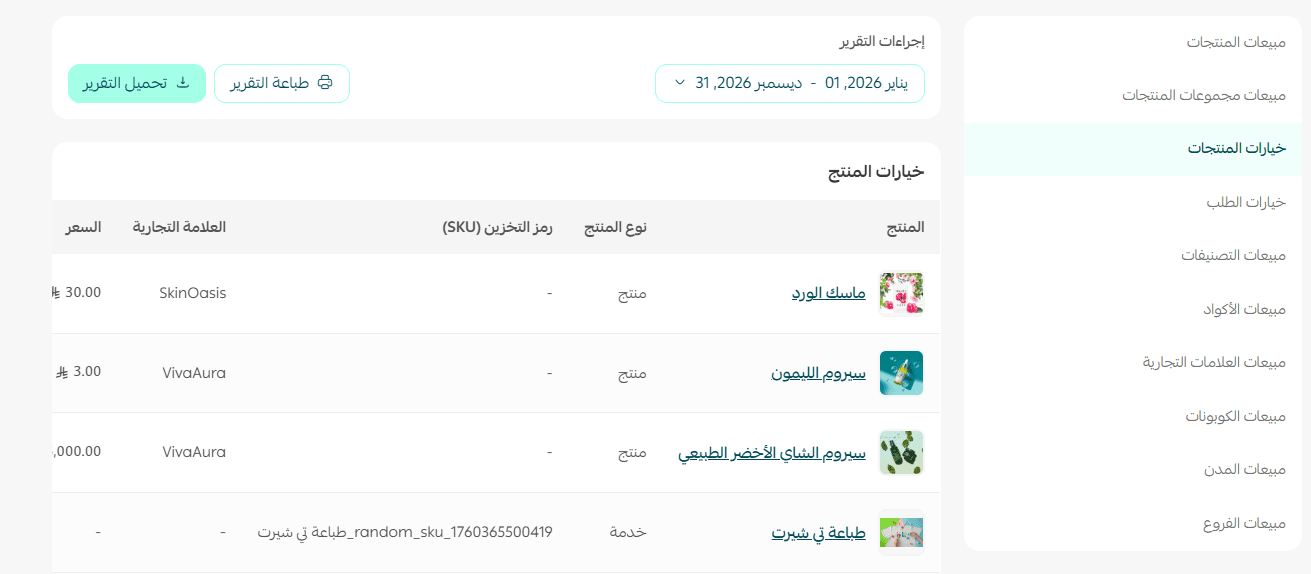
Order option sales
Shows how the different order options used during checkout performed.
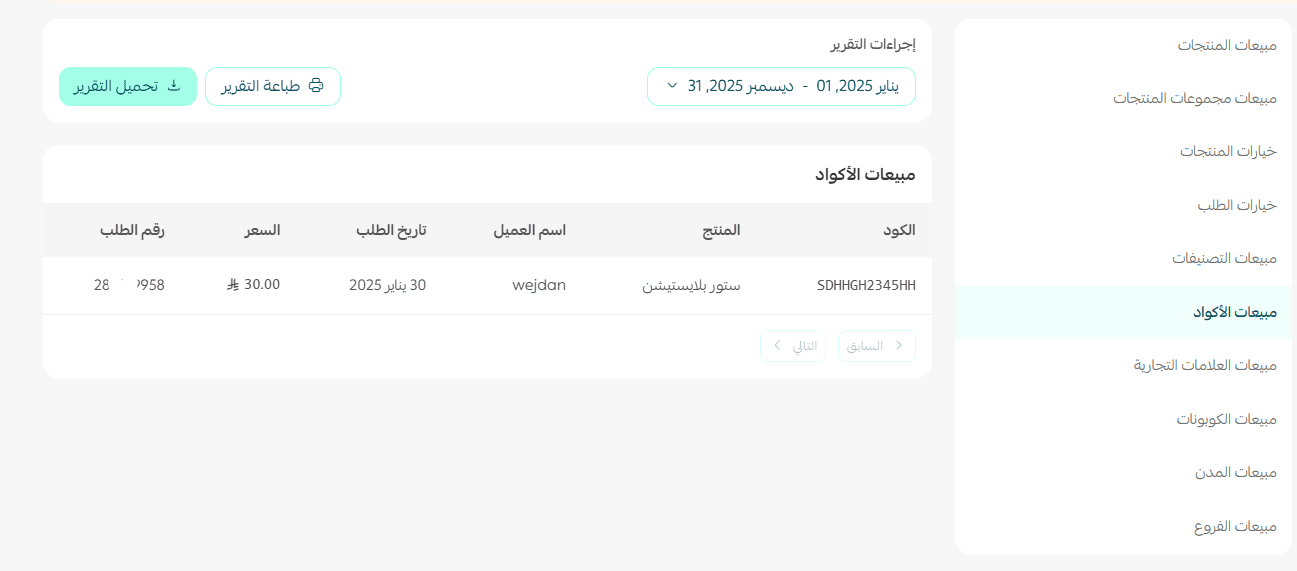
Code sales
Lets you track how the codes used in your store performed and analyze their results.
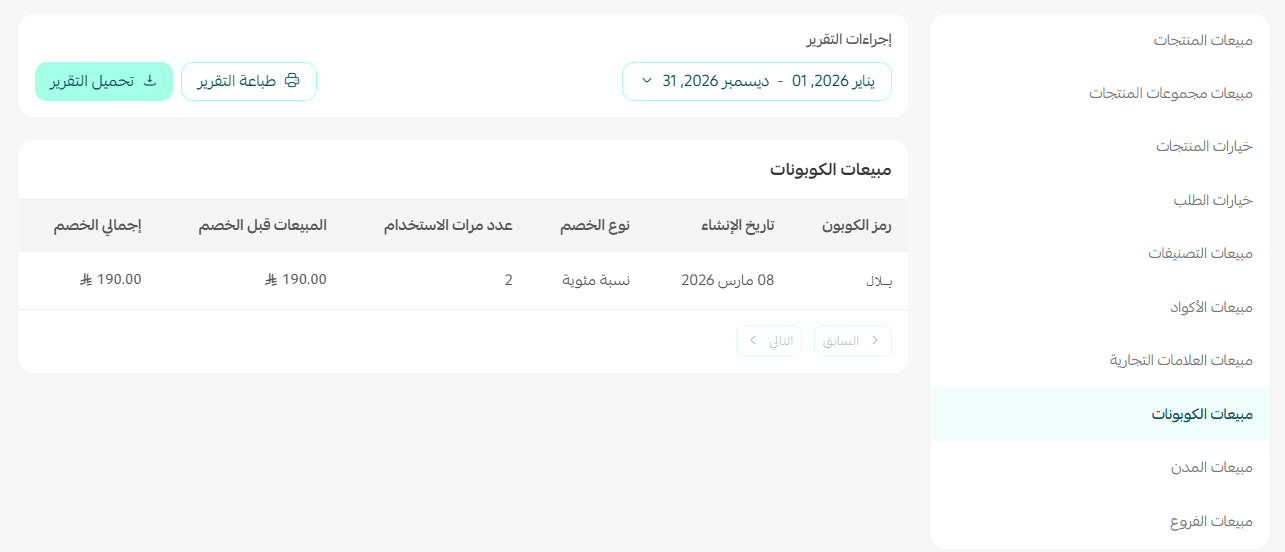
Discount coupon sales
Shows sales from the orders where a discount coupon was used, so you can measure the impact of your promotions.
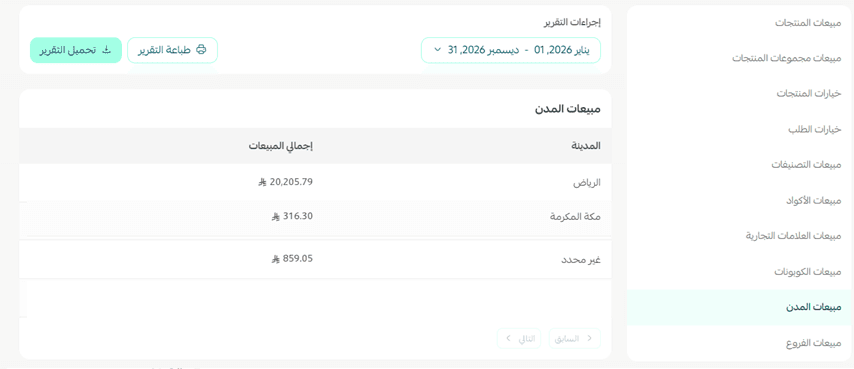
City sales
Shows how sales are spread across cities, so you can see which markets are busiest.
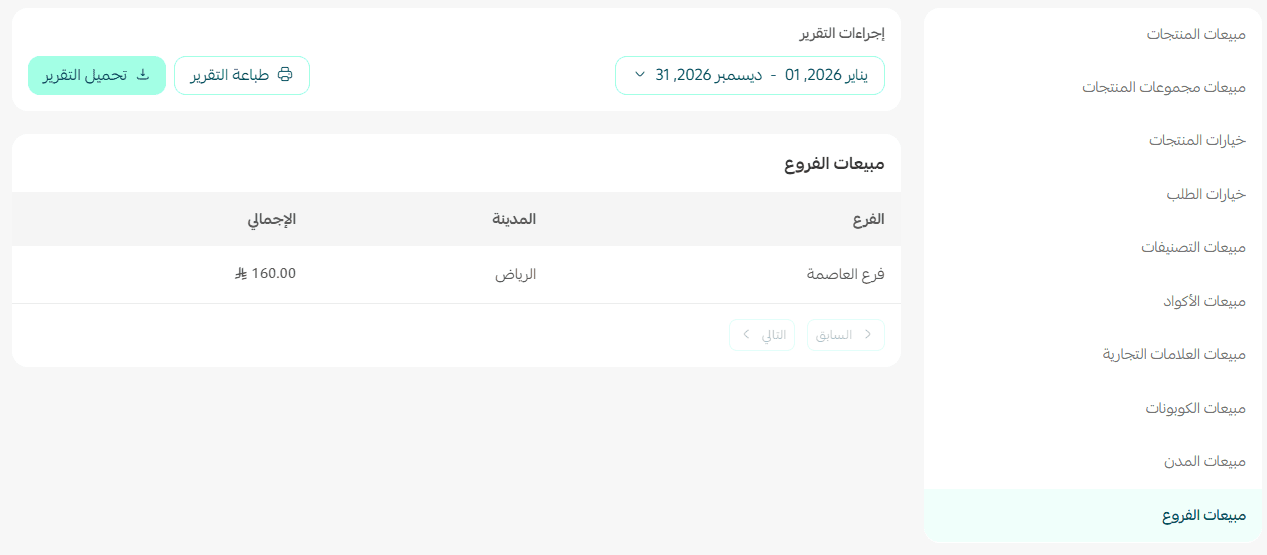
Branch sales
If your store has more than one branch, you can follow each branch's performance and compare it with the others.
💡 Worked examples for reading your sales reports
1. Total sales rose but the order count fell
Example
- Last month: 1,000 orders, SAR 200,000 in total sales.
- This month: 800 orders, SAR 220,000 in total sales.
What it means: even with fewer orders, customers are spending more per purchase, which pushed total sales up.
What to do: look at average order value. The cause may be:
- Product bundles are working.
- More sales of higher-priced products.
If a particular campaign caused it, consider running it again.
2. The order count rose but total sales fell
Example
- Last month: 500 orders worth SAR 150,000.
- This month: 700 orders worth SAR 145,000.
What it means: more orders, but each one is worth less.
What to do: encourage customers to buy more by using:
- Free shipping above a set amount.
- Bundle offers.
- Suggested complementary products.
3. Average order value is falling
Example: the average order fell from SAR 320 to SAR 240.
What it means: customers are buying fewer items, or cheaper ones.
What to do:
- Build bundles that combine more than one product.
- Turn on buy-more-save-more offers.
- Show related products on the product page or in the cart.
4. The repeat purchase rate is rising
Example: the repeat purchase rate rose from 18% to 35%.
What it means: more customers came back to buy again, which is a good sign of satisfaction and loyalty.
What to do:
- Protect the customer experience you already have.
- Set up a loyalty or points program.
- Send special offers to existing customers.
5. The repeat purchase rate is falling
What it means: customers buy once and do not come back.
What to do:
- Review the post-purchase experience.
- Send email or SMS campaigns to past customers.
- Offer a coupon for a second purchase.
6. The return rate is rising
Example: the return rate rose from 2% to 8%.
What it means: something is hurting customer satisfaction. The cause may be:
- An inaccurate product description.
- Photos that do not reflect the real product.
- Quality problems.
- Damage during shipping.
What to do:
- Review the most-returned products.
- Improve product descriptions and photos.
- Review packaging quality or the supplier.
- Review your shipping companies' ratings.
7. The abandoned cart recovery rate is falling
Example: the rate fell from 22% to 10%.
What it means: fewer customers came back to finish the purchase.
What to do:
- Review the timing of your abandoned-cart messages.
- Try adding a small coupon inside the message.
- Make sure the checkout page is fast and easy.
8. One sales channel starts selling less
Example: mobile app sales dropped while the website held steady.
What it means: the problem may sit in that channel rather than in the store.
What to do:
- Test the buying experience in the app yourself.
- Review the marketing campaigns aimed at that channel.
- Confirm there is no technical fault.
9. One product sells strongly, month after month
What it means: that product is a real strength in your store.
What to do:
- Increase its stock.
- Put it at the center of your ad campaigns.
- Show complementary products alongside it to lift average order value.
10. A whole category's sales dropped
What it means: the decline is not in one product but across a whole group of them.
What to do:
- Review how products are ordered inside the category.
- Create offers specific to that category.
- Improve how visible the category is on the homepage.
11. A coupon gives large discounts but does not lift sales
What it means: the coupon is cutting revenue without producing a real increase in orders.
What to do:
- Compare the order count before and after the coupon launched.
- Try a smaller discount percentage.
- Set a minimum order value before the coupon applies.
12. One city is growing quickly
What it means: demand from that city is rising.
What to do:
- Target it with ad campaigns.
- Improve the shipping options available to it.
- Offer something specific to its customers if it looks like a promising market.
📝 Important notes
💡 Do not judge your store on a single metric. Total sales can rise on the back of a higher average order value even as orders fall, and sales can slip because one channel weakened rather than the whole store. Read the metrics together and the picture gets sharper, and so do the decisions.
❓ Frequently asked questions
Where do I find sales reports in Salla?
There are two places. For the general dashboard, go to (Reports) then (Store performance) and pick (Sales) as the report type. For the detailed reports, go to (Reports) then (Reports) and choose a specific report from the list.
Does total sales include tax and shipping?
Yes. Total sales covers products, shipping and taxes, is measured before discounts are applied, and excludes returns.
Why did my total sales and my order count move in opposite directions?
Because average order value changed. Fewer, larger orders can raise total sales, and more, smaller orders can lower it. Read the two numbers together with average order value.
How far back does the abandoned cart recovery rate look?
Only the last 60 days. Carts older than that are not counted in the figure.
🔥 Check your sales reports on a regular rhythm. They tell you which products and categories are actually carrying the store and whether your promotions are paying for themselves — which is what turns reporting into growth. 🚀