Do you know how many of your store's visitors actually finish an order?
Traffic on its own tells you very little. What matters is how much of that traffic turns into paid orders, and where the rest of it drops out. The conversion rate report in your Salla dashboard answers both questions: it measures how well your store converts visitors into buyers, and it maps the customer journey stage by stage so you can see exactly where people leave. In this guide, you'll learn how to open the conversion rate report, what each metric means, and how to act on what it shows.
The conversion rate report shows the share of visitors who completed a purchase, the conversion funnel from visit to completed order, the sources your orders come from, and how each paid ad campaign performed. Read together, these four metrics tell you where the shopping journey breaks and which channels deserve more budget.
📌 Article overview
- How to open the conversion rate report
- What each conversion metric means
- Practical examples for reading your conversion rate reports
- Frequently asked questions
👣 How to open the conversion rate report
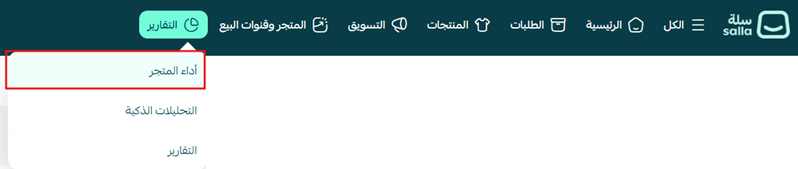
1. From your store's main menu, click (Reports), then click (Store performance).
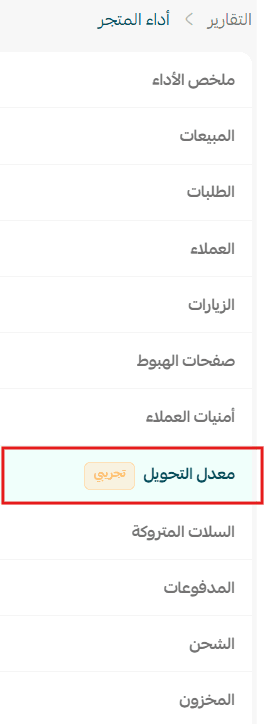
2. Choose the report type (Conversion rate).
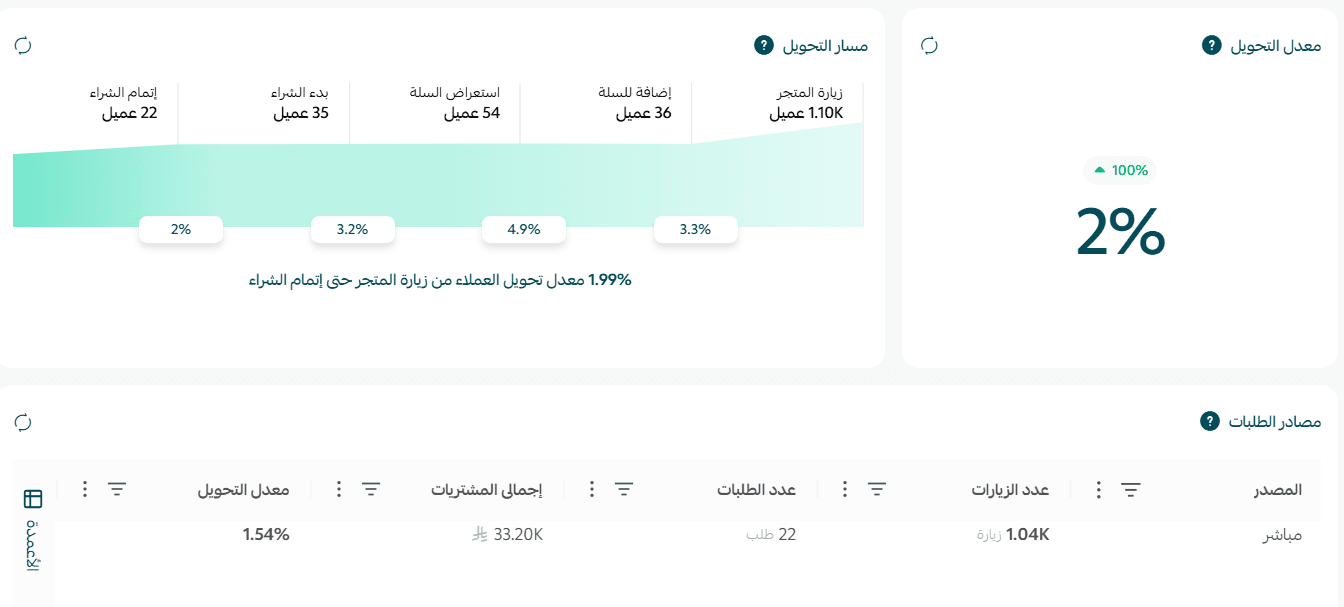
🎯 The conversion rate dashboard shows the key indicators tied to the customer journey inside your store: the conversion rate, the conversion funnel, order sources, and ad campaign performance. Together they show you where customers are lost along the path to purchase, so you can improve both the store and your marketing campaigns and lift the rate of completed orders.
🎯 What each conversion metric means
Conversion rate
What is it?
The percentage of store visitors who completed a purchase during the selected date range.
How is it calculated?
Conversion rate = (completed orders ÷ total visits) × 100
💡 Example: If 1,000 people visited your store and 30 of them completed a purchase, your conversion rate is 3%.
Why it matters
It measures how efficiently your store turns visitors into buyers, and it is one of the most important performance indicators you have.
Conversion funnel
What is it?
The customer journey step by step, from arriving at your store to completing the order, with the number of customers at each stage.
Stage |
What it means |
Visits |
The customer entered the store or opened one of its pages. |
Add to cart |
The customer added at least one product to the shopping cart. |
Cart view |
The customer opened the shopping cart page to review the products. |
Checkout started |
The customer began entering their details and working through the payment steps. |
Order completed |
The customer finished the purchase successfully and the order was created. |
Why it matters
It shows you the exact stage where customers walk away, so you can find and fix whatever is stopping orders from being completed.
Order sources
What is it?
The breakdown of orders and sales by the source of the visit, such as direct visits or social media.
How is it calculated?
Source sales = the sum of (order value − discounts) for every order coming from the same source.
Why it matters
It tells you which channels deliver the best results, so you can point your marketing budget at the sources that actually pay off.
Ad campaign performance
What is it?
The performance of your paid ad campaigns, measured by the number of orders and the sales value each campaign generated.
How is it calculated?
Campaign sales = the sum of (order value − discounts) for every order attributed to the campaign.
📝 Important notes
Only campaigns that generated at least one order appear in this report.
Why it matters
It measures the return on your advertising, and shows which campaigns are working so your marketing decisions rest on data rather than guesswork.
💡 Practical examples for reading your conversion rate reports
Example 1: visits went up but the conversion rate went down
Example:
Last month: 4,000 visits and a 3% conversion rate.
This month: 7,000 visits and a 1.8% conversion rate.
What does it mean?
More visitors reached your store, but a smaller share of them completed a purchase.
What can you do?
- Review your product pages.
- Improve your store's loading speed.
- Check the conversion funnel to find the stage where customers leave.
Example 2: a big drop between add to cart and checkout started
What does it mean?
Customers are interested in the products, but they stop before starting the payment process.
What can you do?
- Review your shipping cost.
- Offer a wider range of payment methods.
Example 3: a big drop between checkout started and order completed
What does it mean?
Customers begin the payment process but do not finish it.
What can you do?
- Test the checkout process yourself.
- Confirm that every payment method is working.
- Reduce the number of steps needed to complete an order, and switch on the express purchase feature.
For more details, see enabling the express purchase feature.
Example 4: one order source drives most of your sales
Example:
40% of sales came from search engines, while social media accounted for no more than 15%.
What does it mean?
That source brings in visitors who are more ready to buy.
What can you do?
- Invest more in that source.
- Work out why it performs well, and apply the same thinking to your other channels.
Example 5: a campaign brings plenty of visits but few orders
Example:
The campaign generated 5,000 visits but only 20 orders.
What does it mean?
The ad attracts visitors, but the product page or the buying experience is not convincing them to finish the order.
What can you do?
- Review the landing page.
- Improve the product description and images.
- Test different offers or marketing messages.
Example 6: a campaign with a high conversion rate
Example:
One campaign generated 300 visits that produced 30 orders.
What does it mean?
The campaign is reaching the right audience and delivering good results.
What can you do?
- Increase the campaign budget gradually.
- Build similar campaigns aimed at a comparable audience.
💡 Tip: Do not judge your store on the conversion rate alone. A drop can come from targeting the wrong audience just as easily as from a problem at one stage of the buying journey. Read the conversion rate alongside the conversion funnel, order sources, and ad campaign performance to get the full picture.
❓ Frequently asked questions
Where do I find the conversion rate report?
From your store's main menu, click (Reports), then click (Store performance), and choose the report type (Conversion rate).
How is the conversion rate calculated?
Conversion rate = (completed orders ÷ total visits) × 100. So 30 completed orders out of 1,000 visits is a 3% conversion rate.
Why does my ad campaign not appear in the report?
Only campaigns that generated at least one order are shown. A campaign with visits but no orders will not be listed.
Do discounts count toward source and campaign sales?
No. Both figures are calculated as the sum of (order value − discounts), so the sales you see are after discounts.
Which funnel stage should I fix first?
Start with the stage that shows the largest drop between one step and the next. That is where you are losing the most orders, and where a fix returns the most.
🔥 Review your conversion rate reports regularly to understand your customers' journey through the store, spot the stages that need work, and judge your marketing channels on results, so you lift the rate of completed orders and grow sales sustainably. 🚀