Do you know which products are quietly draining your stock, and which are sitting on the shelf tying up your cash?
Stock and sales are the same story told from two sides. A product that keeps selling out is lost revenue; a product nobody buys is money frozen in your warehouse. The product and inventory reports in your Salla dashboard connect the two, tracking stock levels, demand, your most profitable and best-selling products, and the products customers show interest in before they ever buy. In this guide, you'll learn how to open the inventory report and the product reports, what each one shows, and how to read them together.
The inventory report shows active carts, units sold, "Notify me when available" requests, and how your catalog splits across stock levels. The product reports then rank products and product groups by profit, sales, demand, abandoned carts, wishlists, and returns.
📌 Article overview
- The inventory report
- The product reports
- Practical examples for reading your inventory and product reports
- Frequently asked questions
👣 The inventory report
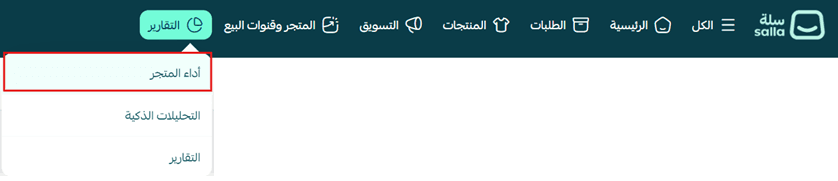
1. From your store's main menu, click (Reports), then click (Store performance).
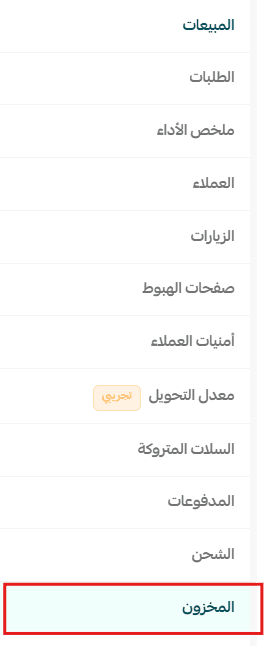
2. Choose the report type (Inventory).
🎯 The inventory dashboard shows the key indicators tied to product movement and stock levels: the number of customers who added products to their cart, the quantity sold from stock, the products customers asked to be notified about, your stock availability breakdown, and the products most often added to wishlists or requested through "Notify me when available". Together they help you manage stock efficiently and lose fewer sales.
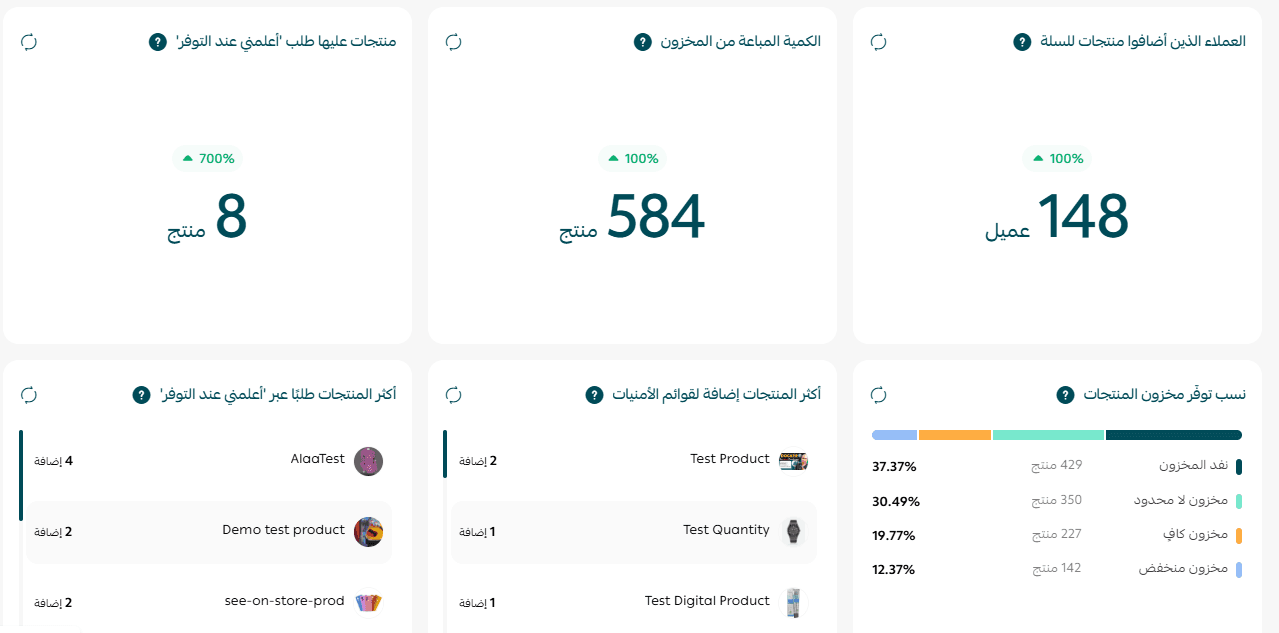
Customers who added products to their cart
What is it?
The number of unique customers with an active shopping cart, meaning they added products to the cart without completing the purchase.
Why it matters
It shows how much interest your products are attracting, and where you can recover sales through abandoned cart campaigns.
Quantity sold from stock
What is it?
The total number of units sold across all products during the selected date range.
Why it matters
It tracks stock movement, shows how quickly products turn over, and tells you when to reorder.
Products with a "Notify me when available" request
What is it?
The number of products customers asked to be notified about when they come back in stock.
Why it matters
It reveals the products in high demand despite being sold out, so you can set your restocking priorities.
Stock availability breakdown
What is it?
How your store's products are distributed across stock states.
Category |
What it means |
Out of stock |
Products with no units available. |
Unlimited stock |
Products whose stock quantity is not tracked. |
Sufficient stock |
Products with more than 3 units available. |
Low stock |
Products with only 1 to 3 units left. |
Why it matters
It gives you your stock position at a glance, and flags the products that need restocking before they run out.
Most-added products to wishlists
What is it?
The products customers added to their wishlists, ranked by how many times they were added during the selected date range.
Why it matters
It shows the products customers want even before they buy them, which is an early signal of expected demand and a useful input for planning offers and stock.
Most-requested products through "Notify me when available"
What is it?
Products ranked by the number of "Notify me when available" requests customers submitted.
Why it matters
It tells you which products customers are waiting for, so you can put them first when you restock.
🔍 The product reports
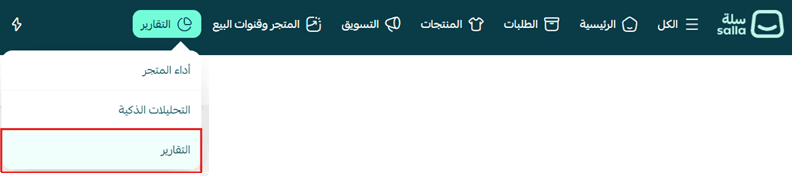
1. From the (Reports) tab in the main menu, click (Reports).
2. From the list of report types, choose (Products).
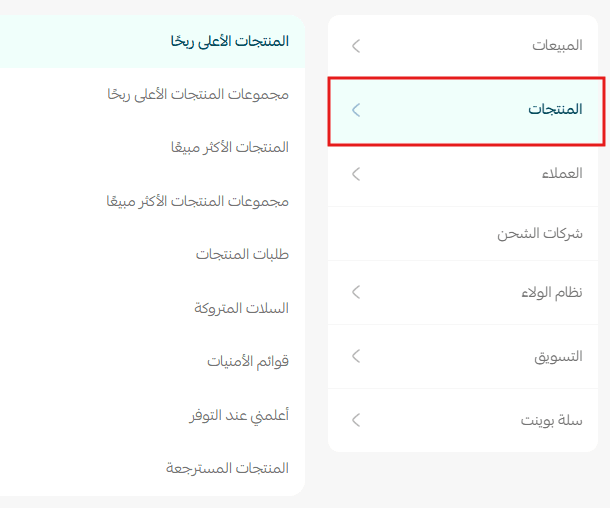
🎯 The product reports let you analyze product performance from several angles: profitability, sales, demand, abandoned carts, wishlists, and returns. Together they give you a deeper view for managing stock and making sharper decisions.
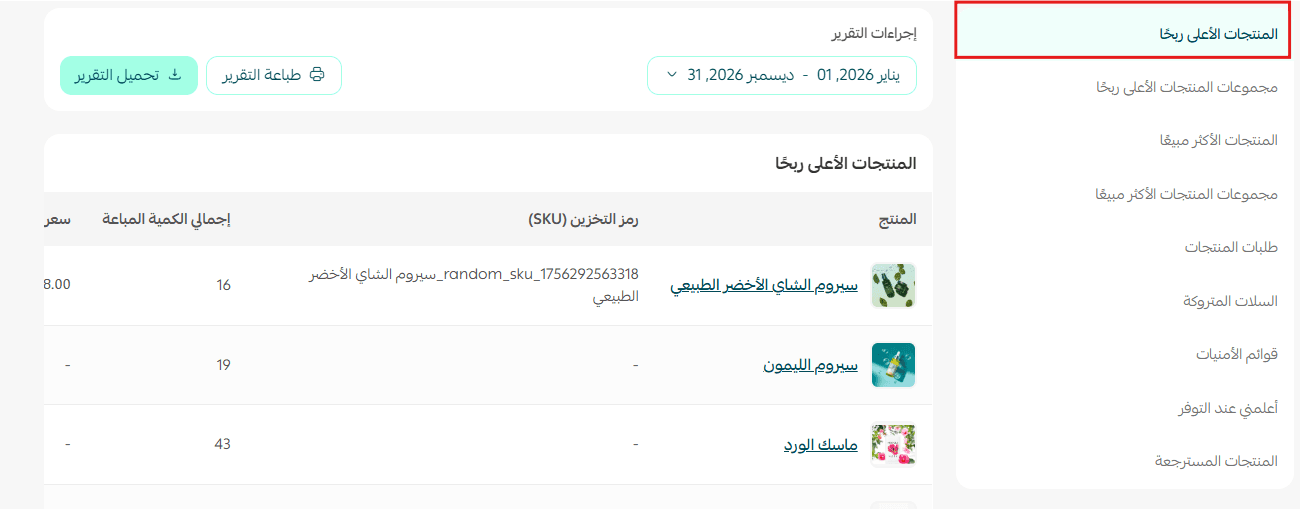
Most profitable products
Ranks products by the total profit they generated during the selected date range, so you can see which products contribute most to your store's profitability.
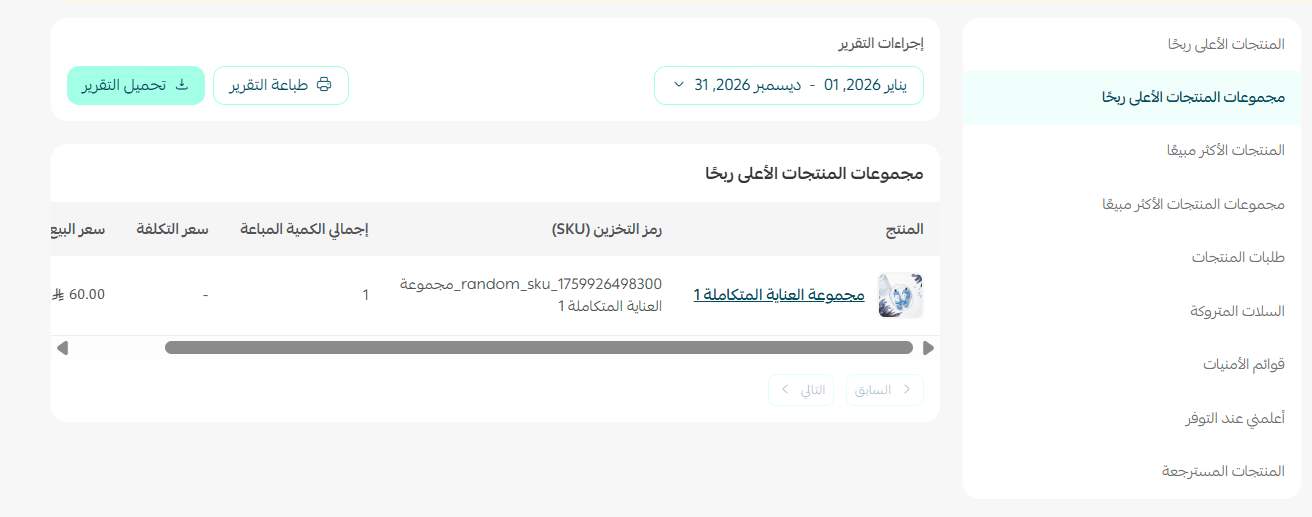
Most profitable product groups
Ranks product groups by total profit, so you can see which groups deliver the best return.
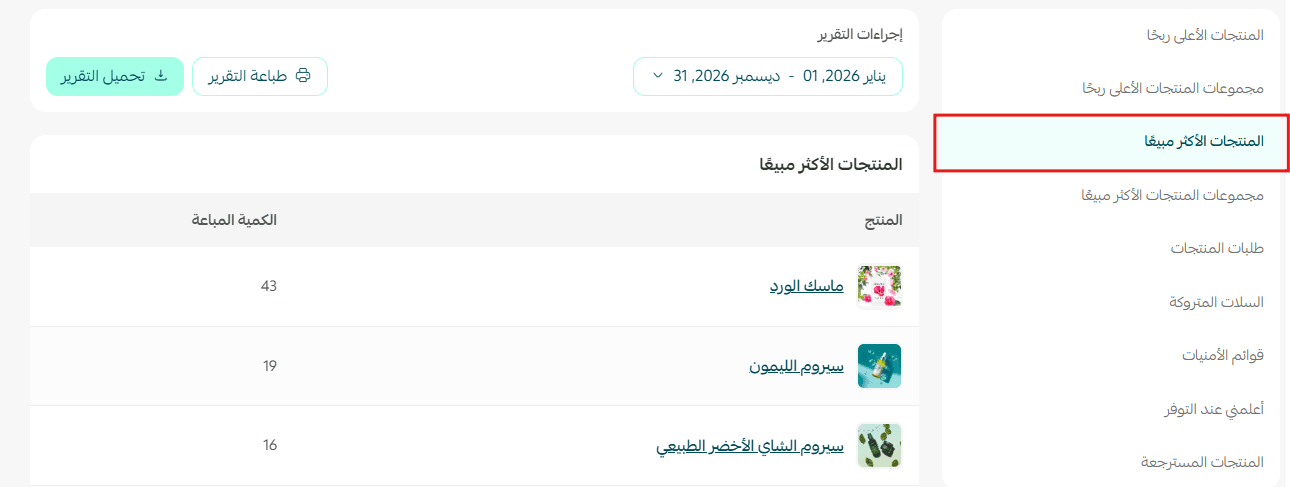
Best-selling products
Ranks products by the number of units sold, so you can see what is in highest demand.
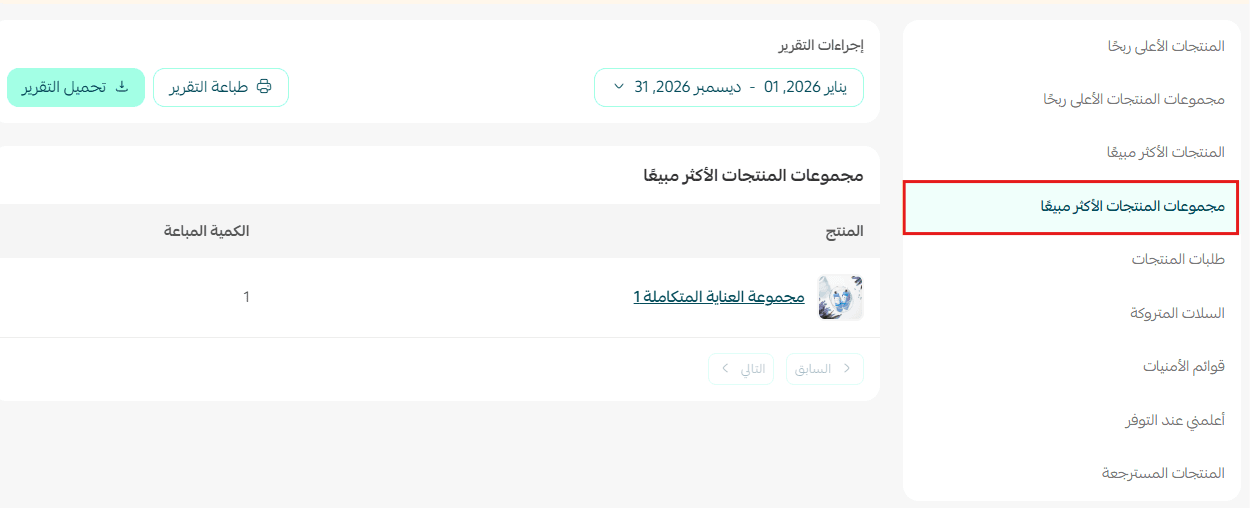
Best-selling product groups
Shows how product groups performed by quantity sold, so you can see which groups sell best.
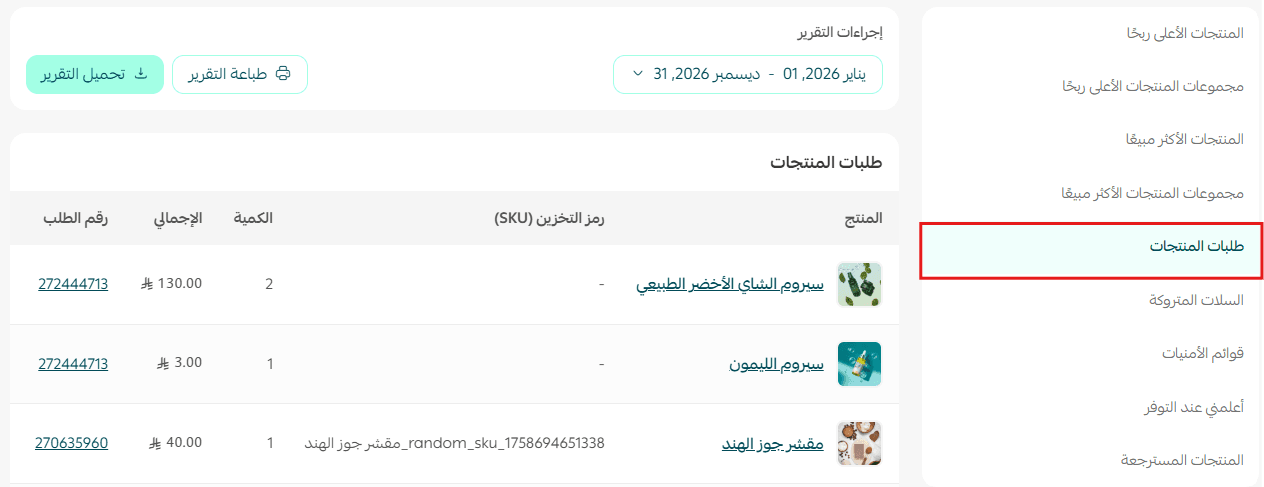
Product orders
Shows the quantities per order during the selected date range, so you can analyze the level of demand on your products.
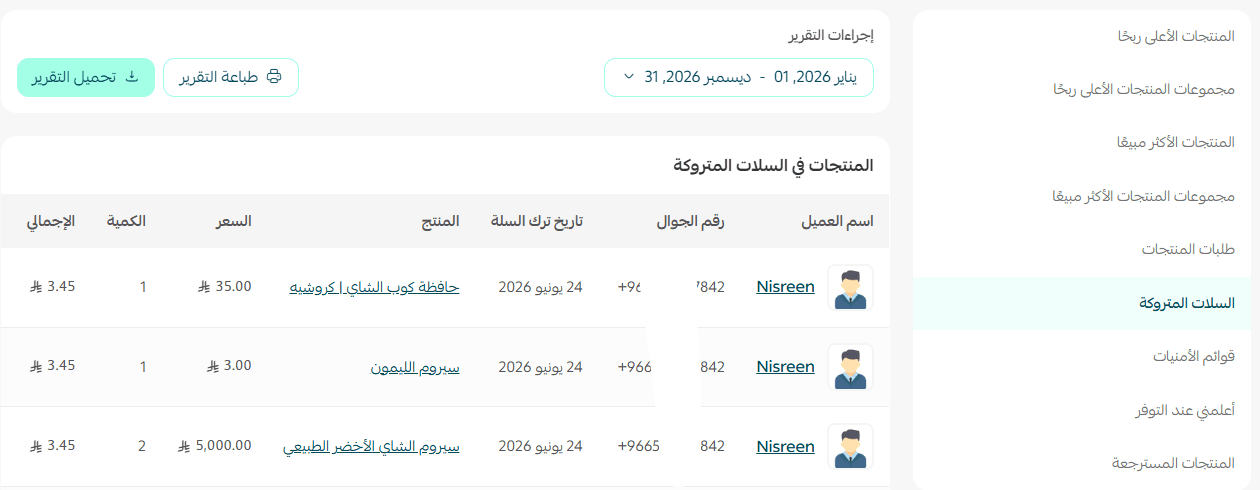
Abandoned carts
Shows the products added to shopping carts without the purchase being completed, together with the customer's details, so you can see which products attract interest but do not turn into sales.
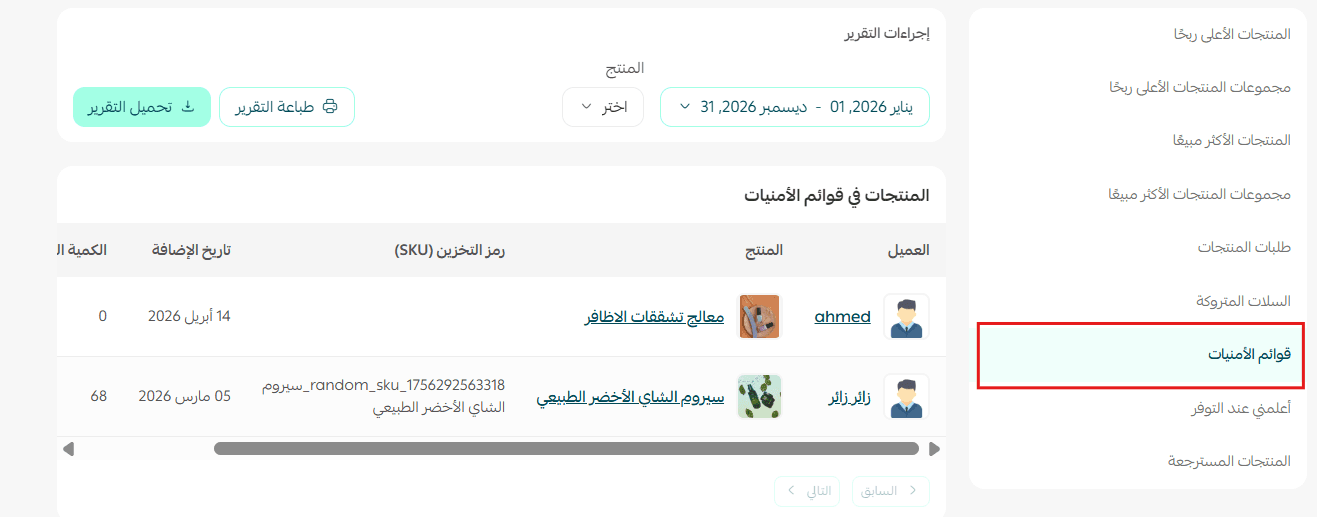
Wishlists
Shows the products customers added to their wishlists along with the customer's details, so you can see what your customers want before they buy it.
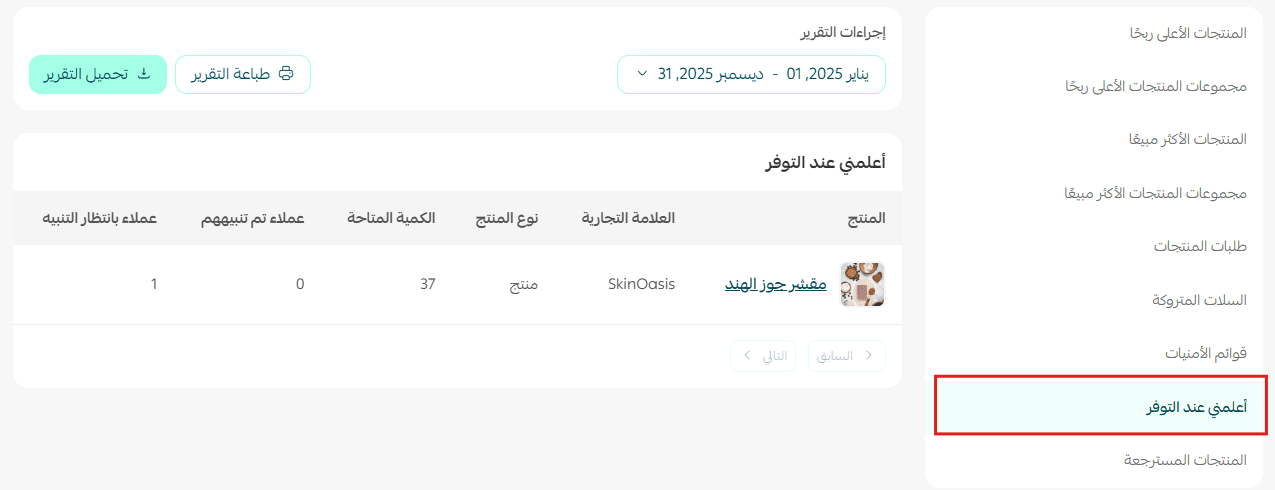
Notify me when available
Shows the products customers asked to be notified about when they are back in stock, so you can identify the products in high demand despite being sold out.
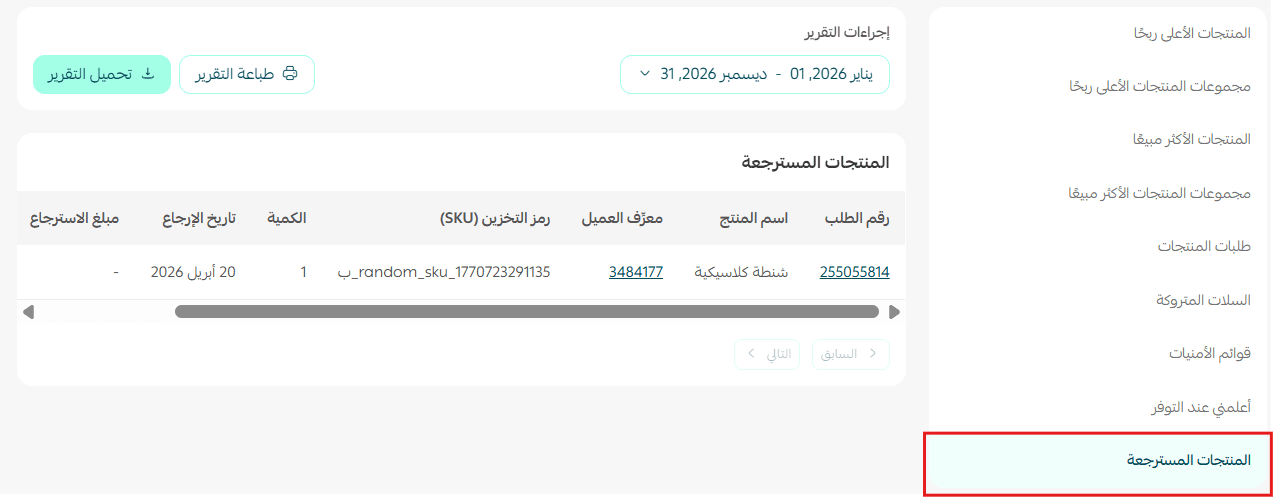
Returned products
Shows the products customers returned after purchase, so you can spot the products with high return rates and look into why.
💡 Practical examples for reading your inventory and product reports
Example 1: more customers are adding products to their cart
Example:
Last month: 100 customers with products in the cart and no completed purchase.
This month: 250 customers.
What does it mean?
There is more interest in your products, but some of those customers did not finish the purchase, and something is likely getting in their way.
What can you do?
- Send abandoned cart reminders.
- Review your shipping cost and delivery time.
- Offer a small incentive, such as a discount or free shipping, to complete the order.
- Watch which products appear most often in abandoned carts to see what attracts the most interest.
Example 2: a product is close to running out but selling well
Example:
A product had 100 units available, and 90 units sold during the month.
What does it mean?
Demand for the product is high and it may run out soon, which would cost you sales.
What can you do?
- Reorder more units before the stock runs out.
- Set a low-quantity alert threshold.
- Track the product's sales rate to size your next order correctly.
Example 3: more products have a "Notify me when available" request
Example:
A product collected 150 availability notification requests in a short period.
What does it mean?
There is clear demand for the product even though it is out of stock, which is a sale you are losing.
What can you do?
- Give the product priority when you restock.
- Notify customers as soon as it is available.
- Review the stock quantity you will need in future to avoid running out again.
Example 4: the share of out-of-stock products is rising
Example:
Out-of-stock products rose from 10% to 35%.
What does it mean?
A large part of your catalog is unavailable, which will show up in both sales and customer experience.
What can you do?
- Identify the products with the biggest effect on sales.
- Restock the high-demand products first.
- Review your purchasing and supply plan to stop the shortages repeating.
Example 5: a product is added to wishlists constantly
Example:
A product was added to wishlists 300 times, but its sales did not match that level.
What does it mean?
Customers want the product, but something is stopping them from buying: price, timing, or availability.
What can you do?
- Run a special offer on the product.
- Compare the product's price against competitors.
- Make sure stock is available while demand is high.
Example 6: a product turns a high profit on low sales
Example:
A product sold only 50 units, but delivered the highest profit in the store.
What does it mean?
The product has a high margin, and there may be room to sell more of it.
What can you do?
- Give it more visibility in your store.
- Use it in your ad campaigns.
- Suggest it alongside your best sellers to raise order value.
Example 7: your best seller is not your most profitable product
Example:
A product recorded 1,000 sales but ranked low on profit.
What does it mean?
The product pulls customers in, but its margin is thin.
What can you do?
- Review the product's cost.
- Try raising the price gradually if the market allows it.
- Use the product to attract customers and suggest add-on products with it.
Example 8: sales of one product group are rising
Example:
The "Accessories" category now accounts for 40% of total product sales.
What does it mean?
There is clear interest in that group of products.
What can you do?
- Increase the stock you hold for that group.
- Build bundles that combine products from the same category.
- Give the group better placement on your home page.
Example 9: returns are climbing
Example:
Returns of one product rose from 5 to 40 in a single month.
What does it mean?
There may be a problem with the product itself, its description, how it is presented, or how it is shipped.
What can you do?
- Review the reasons given for returns.
- Improve the product images and description.
- Check your packaging quality or your supplier.
- Watch customer ratings on the product.
Example 10: a product keeps appearing in abandoned carts
Example:
One product appeared in 200 abandoned carts during the month.
What does it mean?
Customers are interested in the product, but they are not completing the purchase.
What can you do?
- Review the product's price.
- Offer a limited-time deal.
- Add complementary products to raise order value.
- Check that the checkout steps are simple.
Example 11: your best sellers differ from your most profitable products
Example:
Product A is the best seller, while product B is the most profitable.
What does it mean?
The products that move the most volume are not the products that return the most money.
What can you do?
- Keep your best sellers in stock.
- Focus your marketing on the most profitable products.
- Use the high-demand products to promote the high-margin ones.
Example 12: stock is low on a product in high demand
Example:
A product has only two units left, but it appears among your most-requested products and your most-added to wishlists.
What does it mean?
You are very likely to lose sales if the product runs out.
What can you do?
- Restock the product urgently.
- Increase your future order quantity.
- Keep monitoring demand for it.
Example 13: a product has plenty of stock but weak sales
Example:
A product has 500 units available, but sold only 10 units in a month.
What does it mean?
The product is not moving, and it is tying up capital in your stock.
What can you do?
- Run an offer to clear the stock.
- Improve the product images and description.
- Review the product's price.
- Reconsider ordering more of it.
Example 14: sales are strong but stock is not enough
Example:
A product sells 300 units a month, but current stock is only 20 units.
What does it mean?
Your stock does not cover expected demand, and the product could run out within a short period.
What can you do?
- Order a new quantity before the stock runs out.
- Review the average monthly sales.
- Set a safety stock level to keep the product available.
💡 Tip: Having a product in stock does not mean it is earning its place. You can hold a lot of stock in low-demand products, or run out of the products customers actually want. Use the inventory and product reports together to decide what to restock and what needs improving or promoting, so your stock works as hard as it can.
❓ Frequently asked questions
Where do I find the inventory and product reports?
For the inventory report, click (Reports) in your store's main menu, then (Store performance), and choose the report type (Inventory). For the product reports, click (Reports) in the main menu, then (Reports), and choose (Products).
What counts as low stock?
A product with only 1 to 3 units left is counted as low stock. More than 3 units counts as sufficient stock, and no units at all counts as out of stock.
What does "unlimited stock" mean in the availability breakdown?
It covers products whose stock quantity is not tracked, so Salla does not hold a unit count for them.
What is the difference between the wishlists report and the "Notify me when available" report?
The wishlists report shows products customers saved for later, whether or not they are in stock. The "Notify me when available" report shows products that are out of stock and that customers asked to be alerted about when they return.
Why does my best seller not appear at the top of the profit report?
Because volume and margin are different things. A product can sell in large numbers on a thin margin while a slower-selling product returns more profit per unit.
🔥 Review your inventory reports regularly to keep your most-wanted products available, plan restocking better, and cut the number of times you run out, so sales rise and your customers get a better experience. 🚀