Struggling to get a clear, real-time view of your store’s performance can slow down decision-making and limit growth. The Salla dashboard is designed to solve exactly that. It brings your most important data into one place, from store summaries and performance metrics to smart analytics and detailed reports.
This guide walks you through every section of the homepage so you can track growth, spot opportunities, and make confident, data-driven decisions faster.
📌 Article overview
1. Homepage sections
- Store Summary
- Store Performance
- Smart Analytics
- Reports
- Dashboard Search
2. Practical use cases for smarter decision-making
Homepage sections
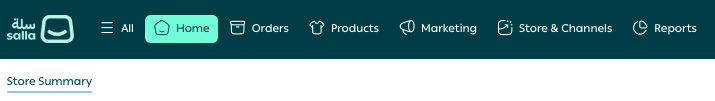
Store Summary page
From the Homepage, click Store Summary.
This section gives you an instant snapshot of your store’s most critical data, helping you act quickly and confidently. It includes monthly goals, quick navigation shortcuts, latest orders, recent visits, and abandoned carts.
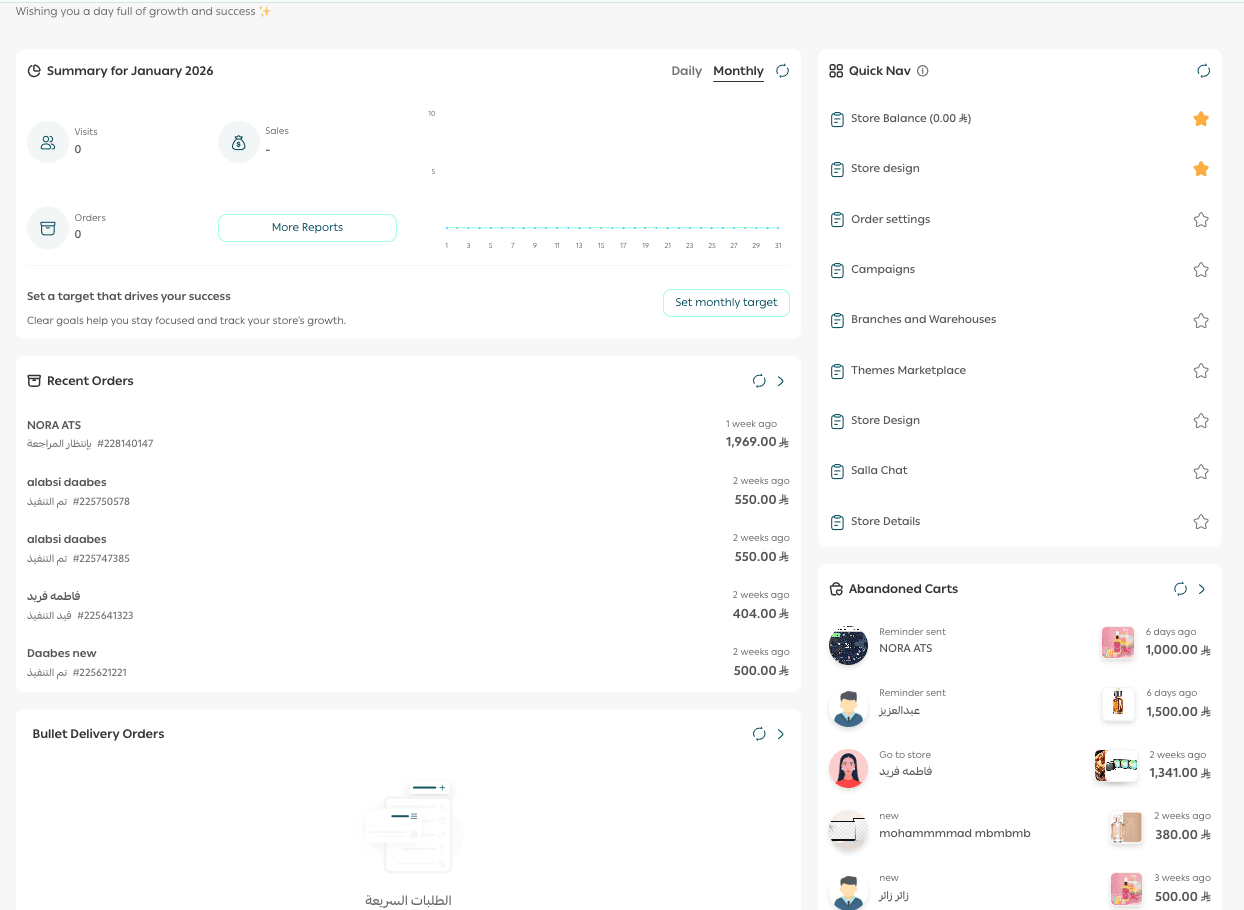
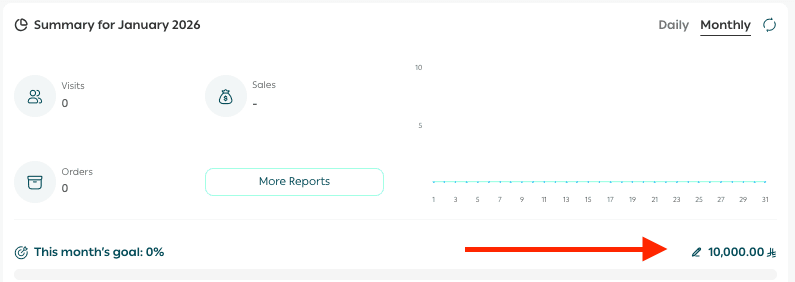
1. Monthly goal
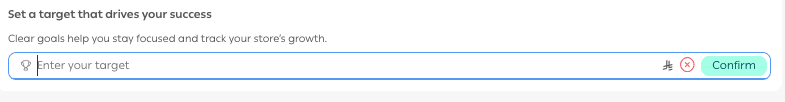
- Set a monthly sales goal and track your progress continuously to stay motivated and focused.
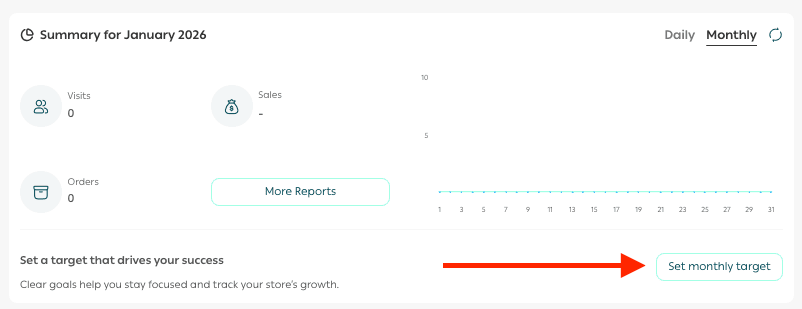
- Enter your monthly sales target, then click Confirm. To remove the goal, click X.
Your goal appears directly on the homepage with a live progress indicator. You can update the target at any time by clicking the edit icon.
2. Quick navigation
A smart shortcut panel that gives you fast access to your most important store metrics.
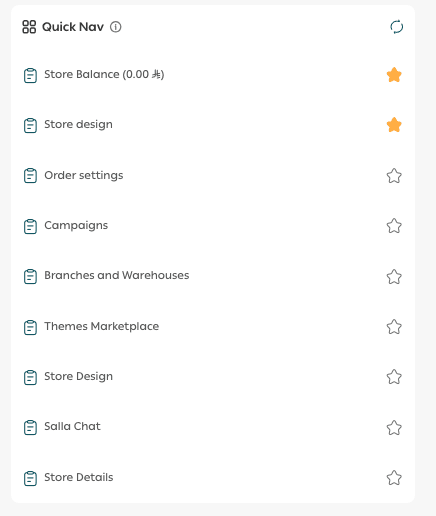
You can pin up to 10 recently visited pages, making it easier to return to key areas without navigating through menus.
3. Abandoned carts
Track abandoned carts for each customer and view:
- Products left behind
- Customer details
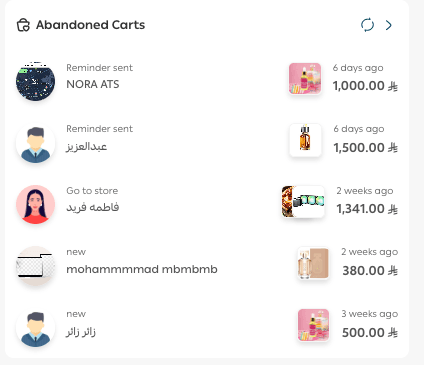
This data helps you retarget shoppers and recover lost revenue with precision.
4. Recent orders
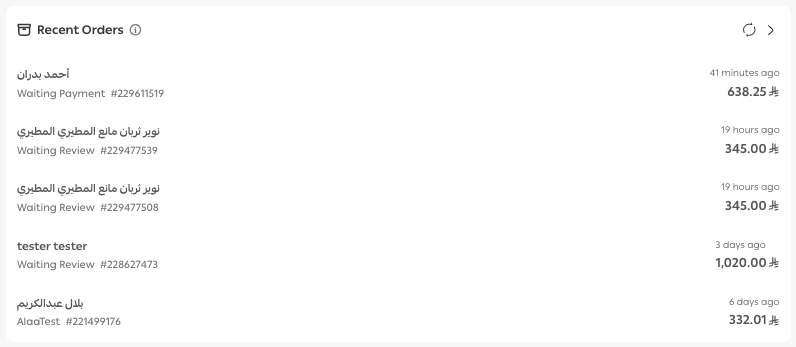
Monitor your most recent orders in real time and access full order details instantly, helping you stay on top of operations as they happen.
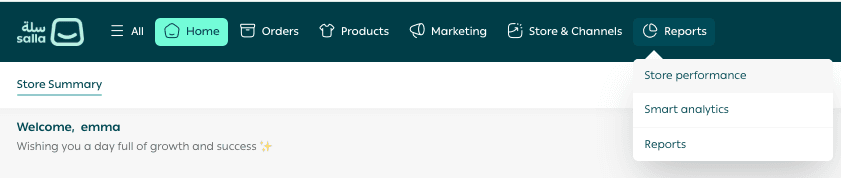
Store Performance page
From the top navigation bar, go to Reports, then select Store Performance.
This section presents your core performance metrics in one place, including:
- Overall store performance
- Sales
- Customers
- Visits
- Abandoned carts
- Wishlists
- Payments
- Shipping
- Inventory
- Staff activity
- Operational insights
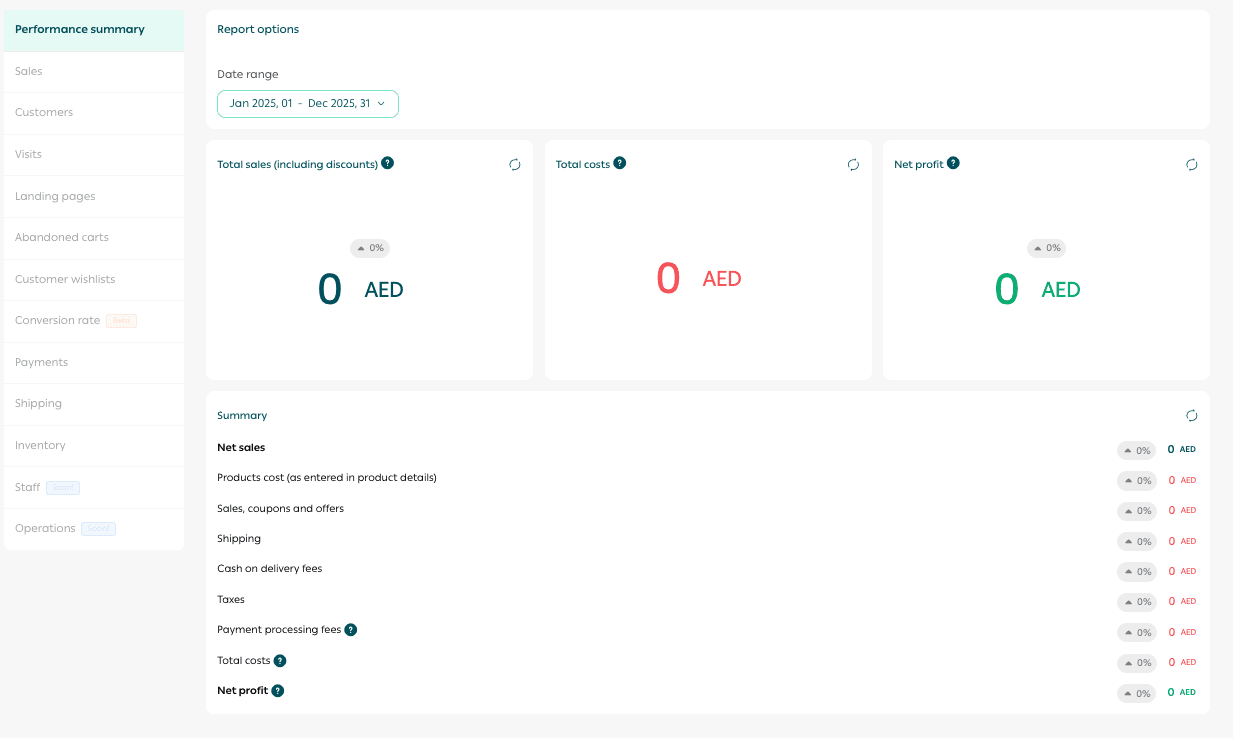
These metrics support both marketing and operational decisions by clearly showing how your store is performing over time.
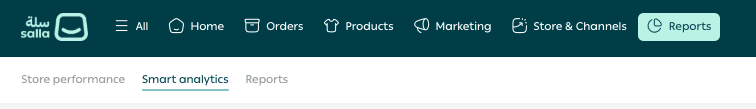
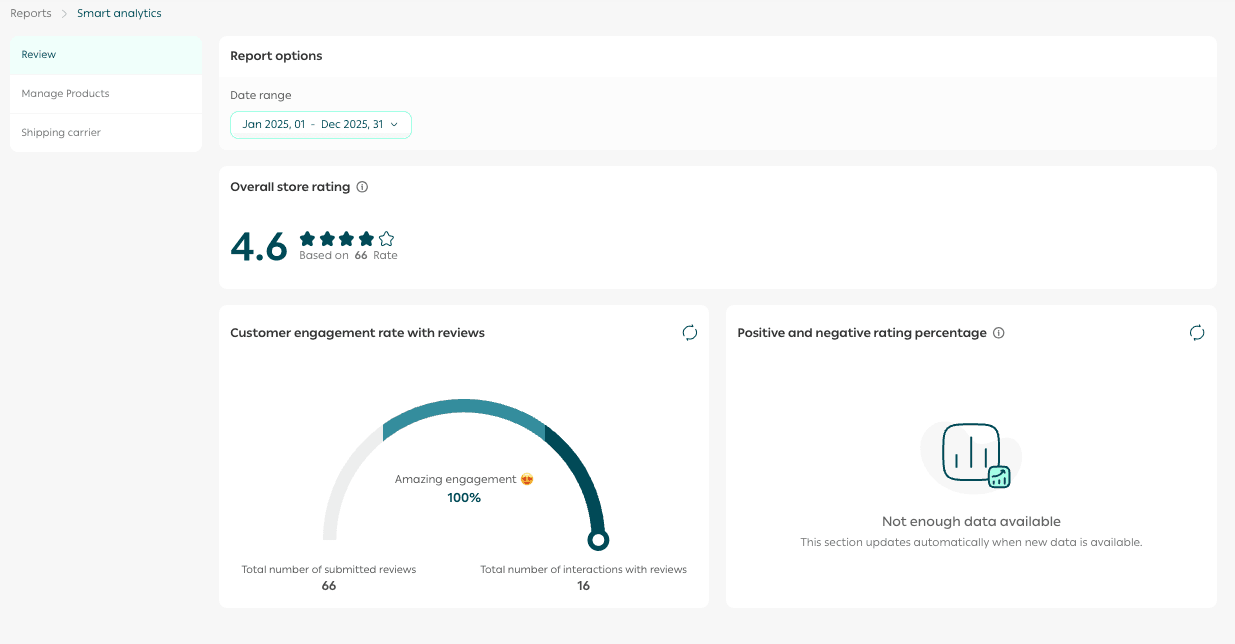
Smart Analytics page
From Reports, open the Smart Analytics tab.
This section delivers deeper insights into your store by analyzing:
- Customer reviews
- Product ratings
- Shipping company feedback
Data is presented in a simple, easy-to-understand format that highlights improvement opportunities and helps you enhance the customer experience.
Reports page
From Reports, click the Reports tab .
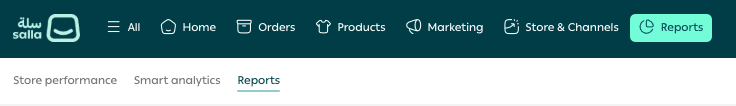
Here you’ll find detailed reports covering:
- Sales performance
- Products
- Payments and shipping
- Loyalty programs
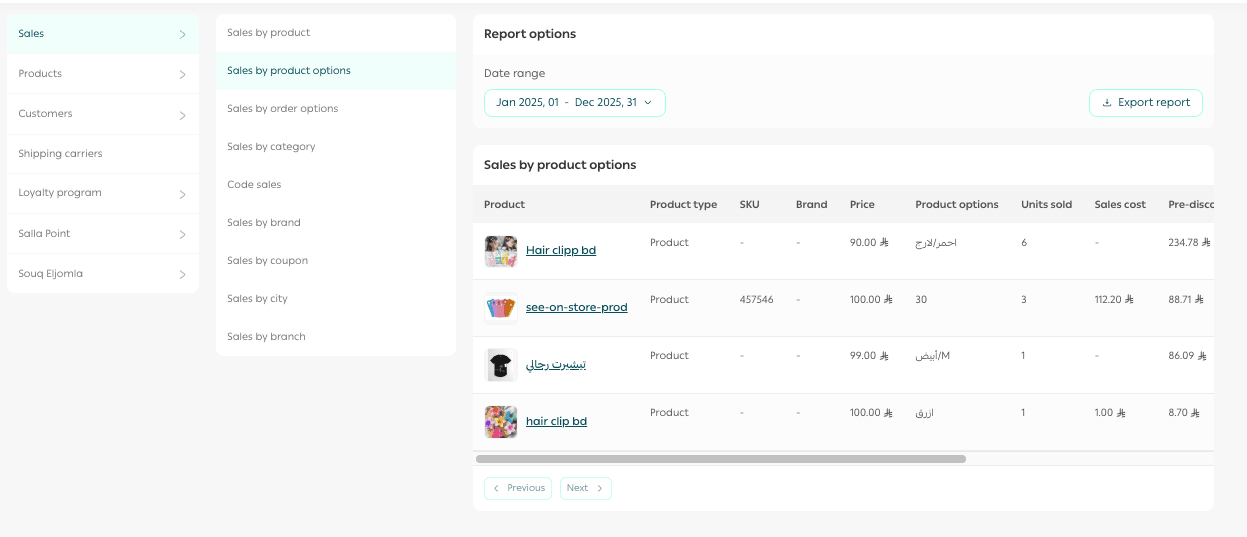
These reports make it easier to monitor both financial and operational performance with clarity and accuracy.
Searching within the dashboard
From the Homepage, use the search bar at the top.

Type any page name, setting, or feature, and all related results will appear instantly.
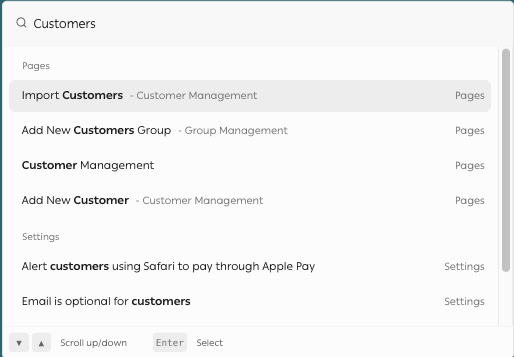
Click any result to jump directly to the relevant page.
This makes navigation faster and keeps your workflow efficient.
Practical use cases for the homepage
Driving sales using monthly goals
By displaying the Monthly Goal in the Store Summary, you can align promotions with progress milestones.
Example:
When the store reaches a certain percentage of its target, you can launch a limited-time offer to encourage customers to help complete the goal.
Encouraging repeat visits
Using Latest Visits, you can identify customers who return frequently and engage them with:
- Personalized discount codes
- Invitations to explore new collections
This increases the likelihood of turning visits into purchases.
Recovering abandoned carts
With the Abandoned Carts section, you can retarget customers who left items behind using tailored incentives.
Example: Offer a discount or free shipping if the purchase is completed within 24 hours.
Launching campaigns during peak traffic hours
By combining insights from Latest Visits and Store Performance, you can identify high-traffic time periods.
Example: If evenings or weekends show increased activity, schedule strong promotional campaigns during those windows to maximize conversions.
Rewarding loyal customers
Using Store Performance and Reports, you can identify repeat buyers and high-value customers.
Example: Offer loyalty points for every purchase to strengthen relationships and encourage long-term engagement.
Aligning marketing with operational performance
With Smart Analytics and Reports, you can synchronize marketing strategies with real performance data.
Example: If analytics show that certain products perform exceptionally well after campaigns, you can scale those campaigns strategically to drive even stronger results.