Google Play Console provides a powerful analytics dashboard that allows you to monitor your app’s performance in detail. Through built-in reports and insights, you can better understand user behavior, track growth, and compare your app’s performance against similar apps on Google Play.
This guide explains how to access app analytics and interpret the most important performance indicators.
How to access Google Play Console
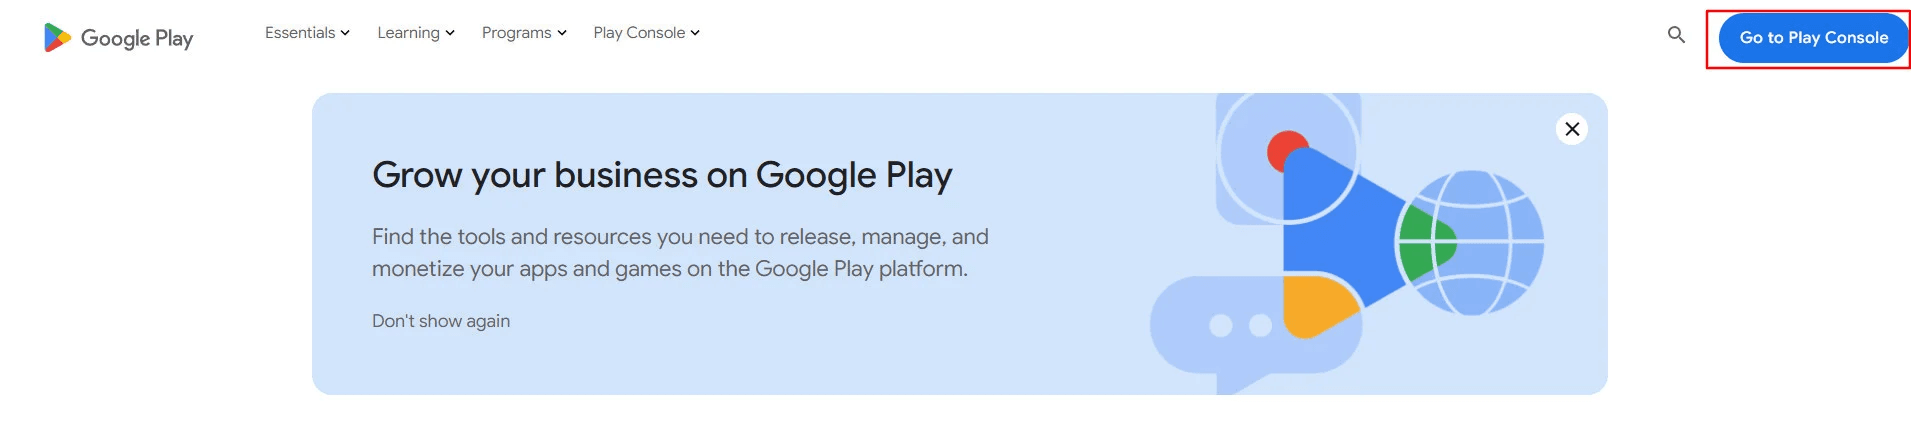
1️⃣ Open Google Play Console
Go to Google Play Console, then click Go to Play Console.
2️⃣ Select your developer account
Choose the developer account associated with your email address.
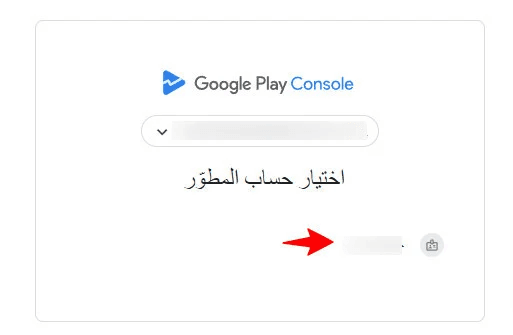
🔹 For more details, see: How to purchase a Google Play Developer account
3️⃣ Select the app
From the account homepage, choose the app you want to analyze.
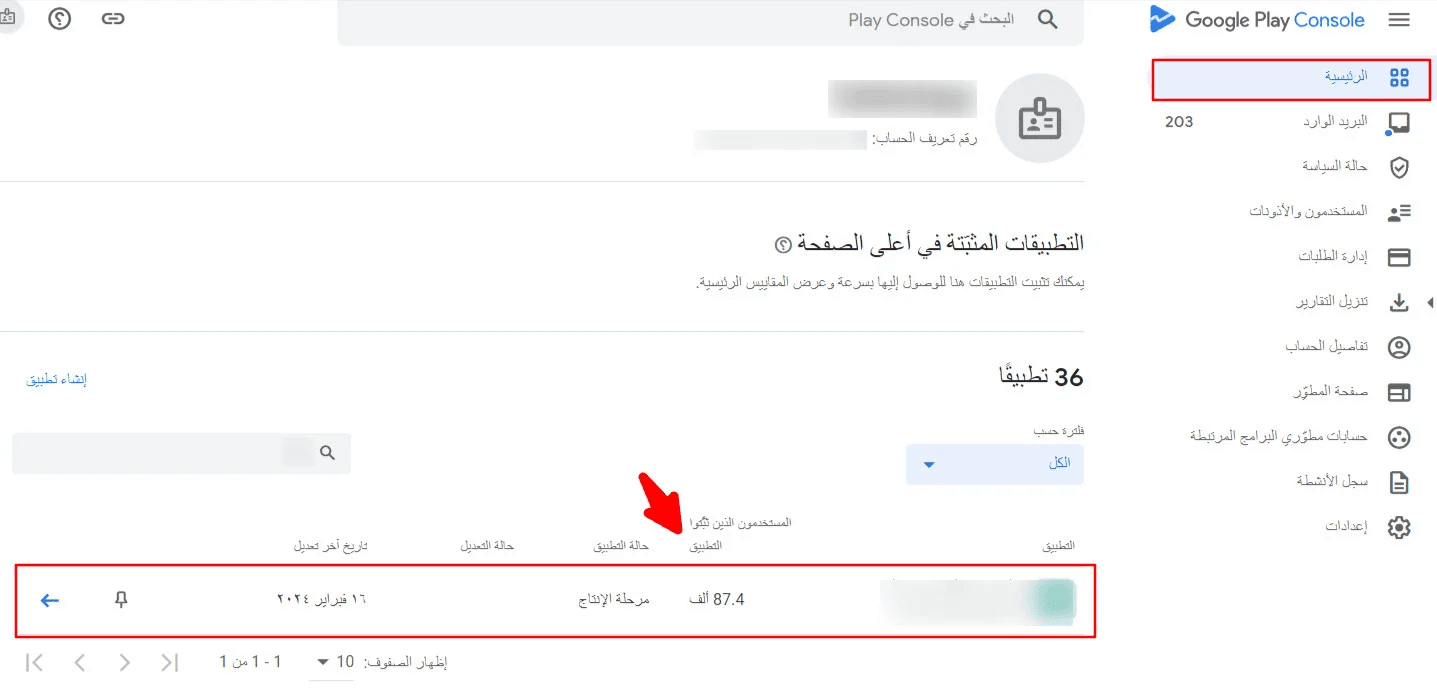
💡 Next to each app, Google Play Console shows an approximate total number of users, which gives you a quick snapshot of overall adoption.
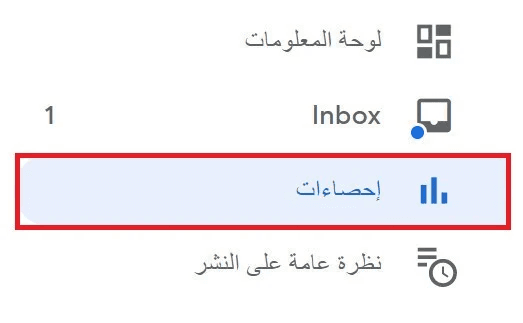
4️⃣ Open the Statistics section
After selecting the app, use the left-hand navigation menu and click Statistics.
5️⃣ Configure the report
Choose:
- The date range
- The countries or regions you want to analyze
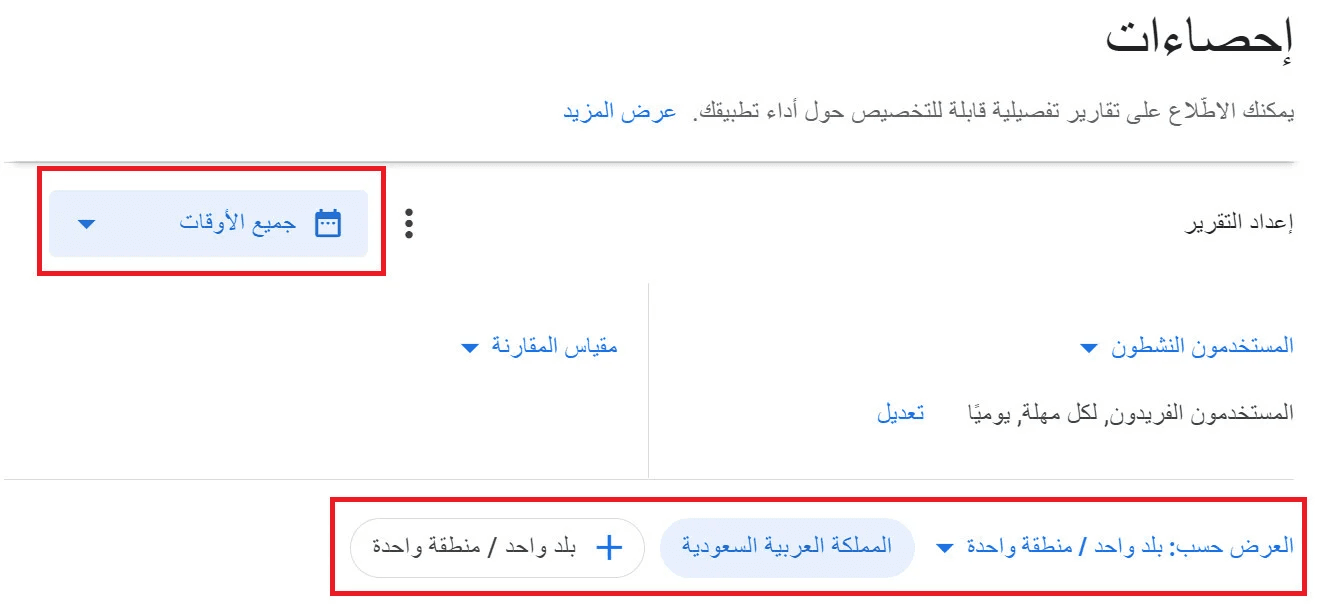
The dashboard will update automatically based on your selections.
Key App Performance Metrics
Google Play Console displays several important analytics views. The most notable ones include:
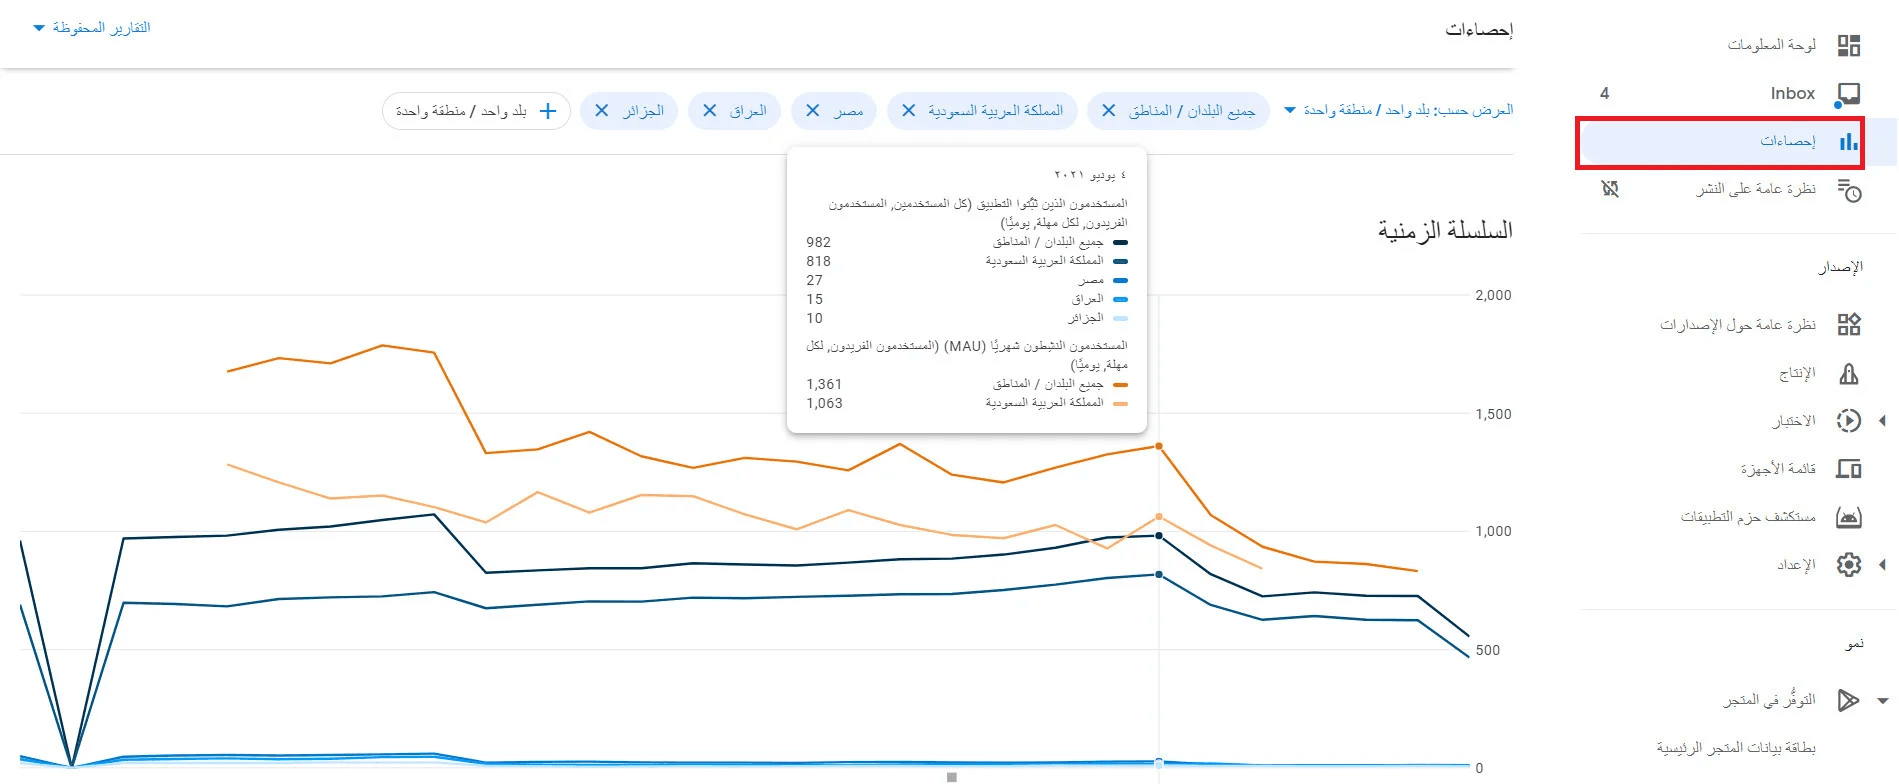
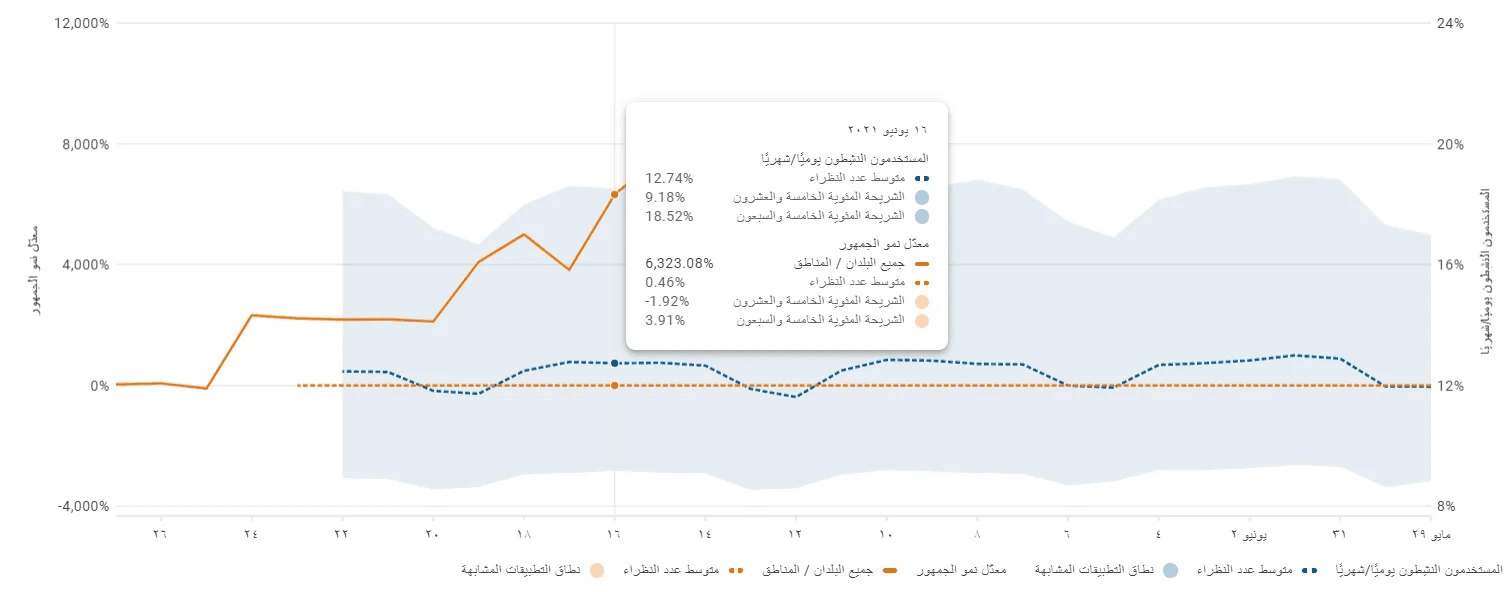
Time Series
The Time Series view displays a line chart showing active users over time, based on the selected date range and regions.
- Hover over the timeline to see changes in user numbers
- Identify growth trends, drops, or seasonal behavior
- Monitor the impact of releases or marketing campaigns
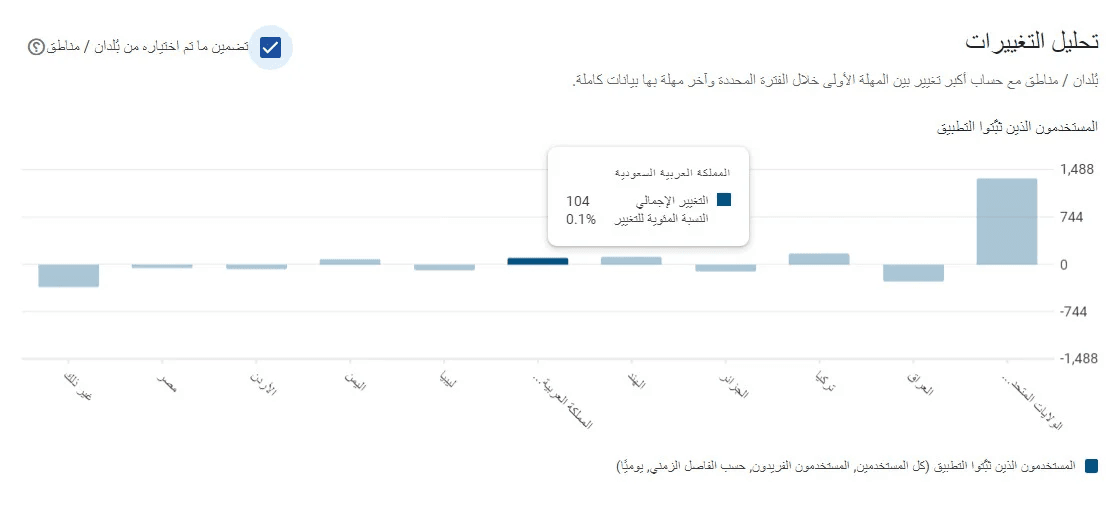
Change Analysis
This section highlights countries or regions with the largest change between:
- The first data point in the selected period
- The most recent complete data point
In simple terms, it shows where your app gained (or lost) the most users during the selected timeframe.
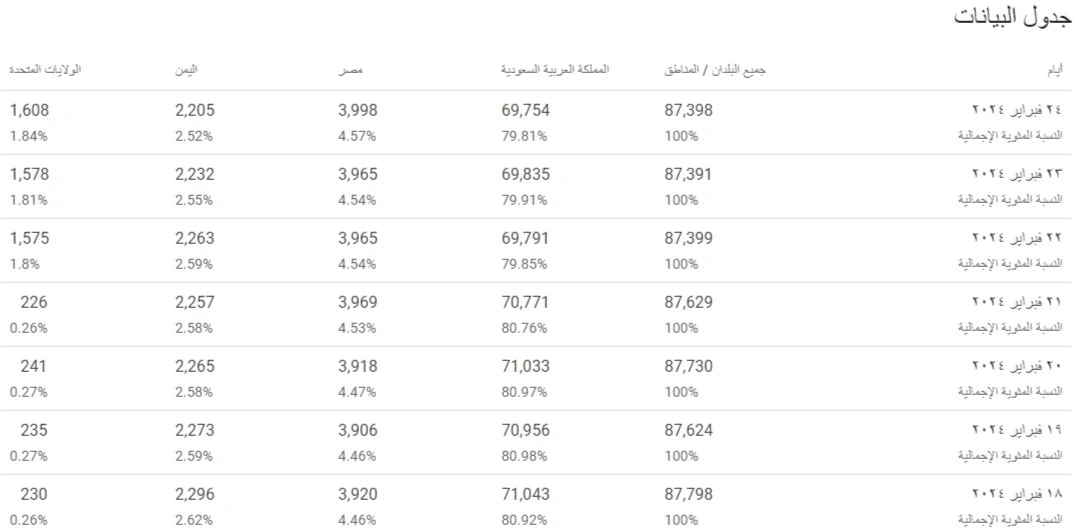
Data Table
The Data Table presents:
- Download or user counts
- Percentage distribution by country or region
- Performance values aligned with the selected date range
This view is useful for exporting data or reviewing performance at a granular level.
Comparison with Similar Apps
Google Play Console allows you to benchmark your app’s performance against similar apps.
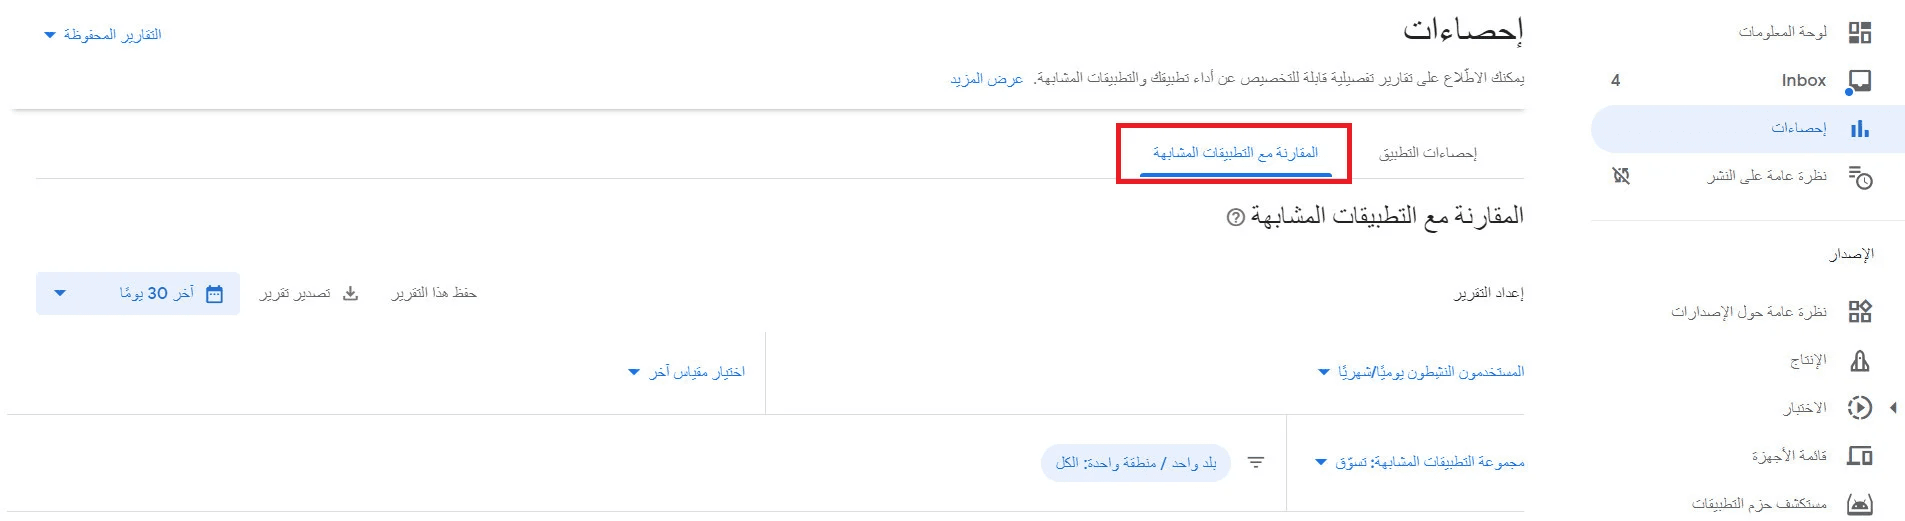
You can:
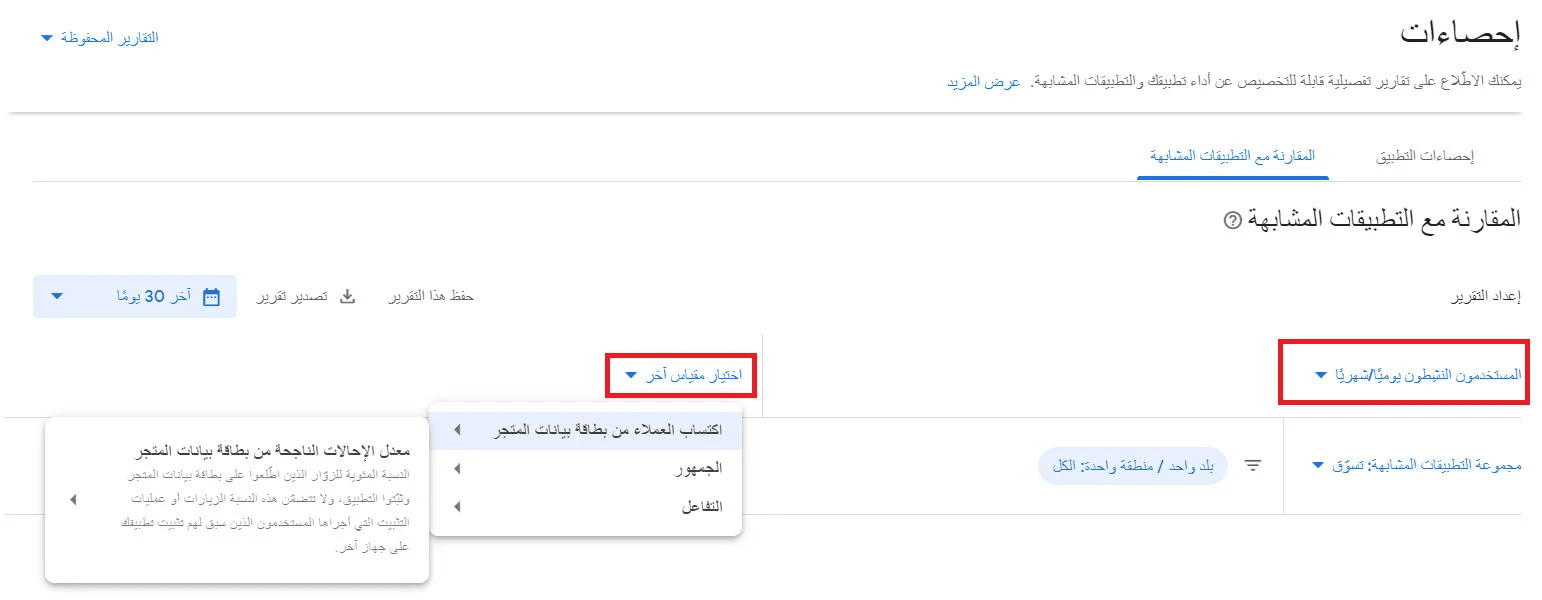
- Select Similar app group
- Choose the app category you want to compare against
- Click Select another metric to define the comparison type (e.g., growth rate, active users)
This helps you understand whether your app is:
- Growing faster or slower than the market
- Performing above or below category averages
🔹 For more details, see: Using Google Play Console to track app performance
Frequently asked questions
Are there metrics other than active users available?
Yes. Google Play Console provides multiple performance metrics.
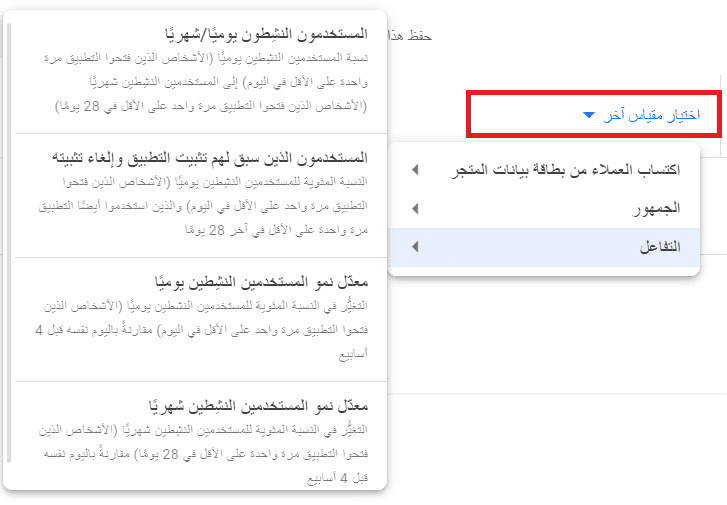
To access them:
- Click Comparison metric
- Select the main metric
- Choose a sub-metric from the available options
For example, you can view Audience Growth Rate reports to better understand how quickly your user base is expanding.
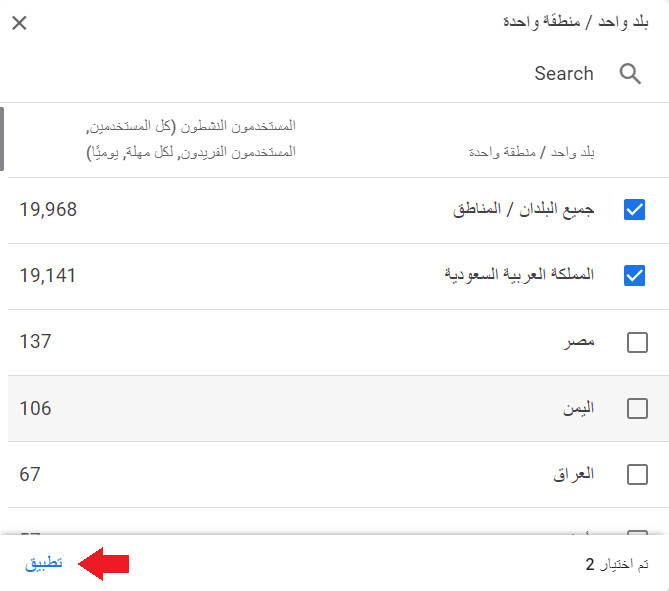
How can I add a country or region to the analytics report?
- From the Statistics page, click + One country/region

2. Select the countries or regions you want to include
3. Click Apply
How can I change the date range for the report?
From the Statistics page:
- Click the date selector
- Choose the time period you want to analyze
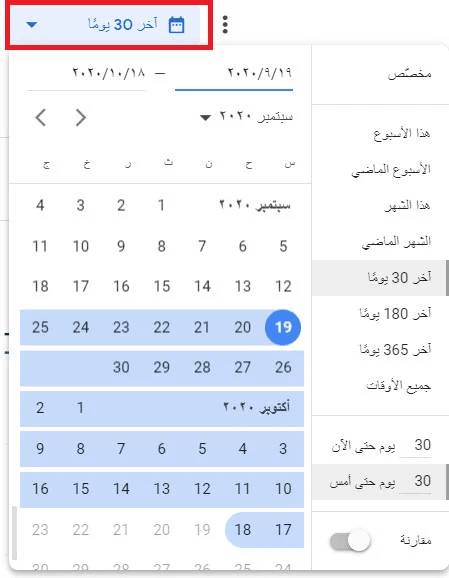
The dashboard will refresh automatically to reflect the selected timeframe.