How often have you struggled to understand your shipping performance or track where shipping costs are really going? When shipping data lacks clarity, unexpected losses can quickly follow.
In this article, you will learn how to use the Shipping Reports page effectively to improve shipping performance, reduce logistics costs, and increase customer satisfaction with data-driven decisions.
📌 Article overview
- Shipping reports page
- Managing the shipping reports page
- Practical use cases for shipping reports
Important: All reports on the shipping reports page apply only to shipping companies available through Salla Shipping Labels.
Shipping reports page
- From your store dashboard, click All, then select Shipping & Delivery.
2. From the tabs menu, click Reports.

The shipping reports page displays several key reports, including:
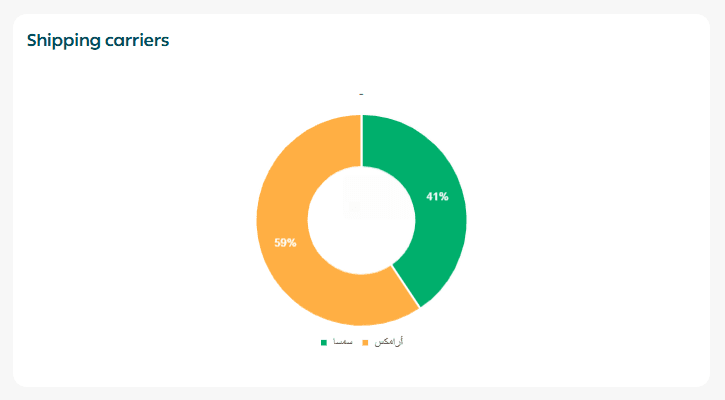
Shipping companies
This section lists the shipping companies you worked with during the selected reporting period.
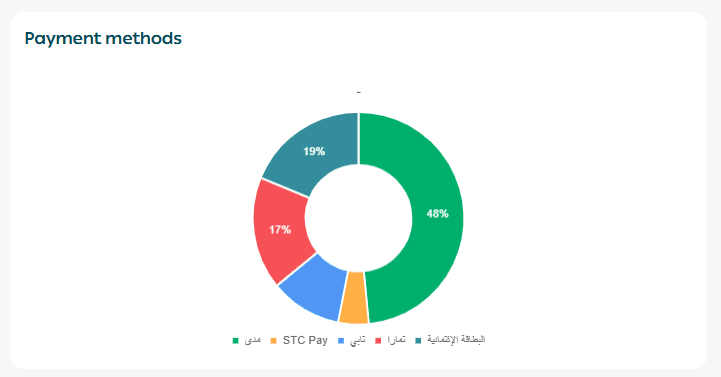
Payment methods
Displays the payment methods used to complete orders.
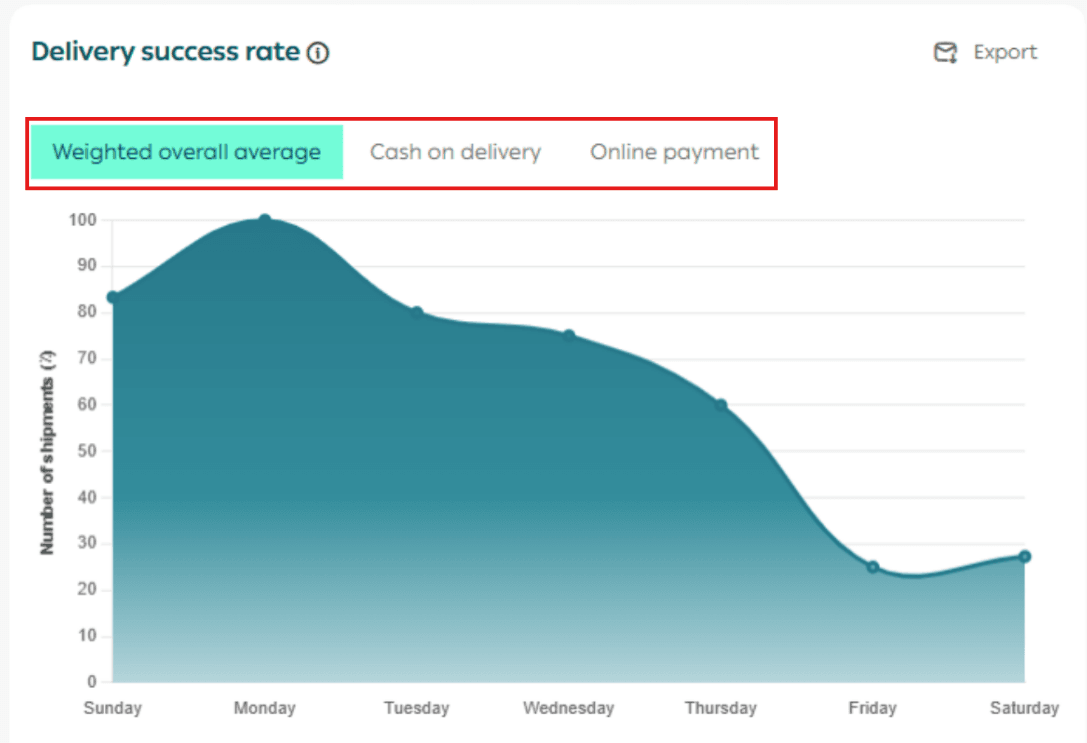
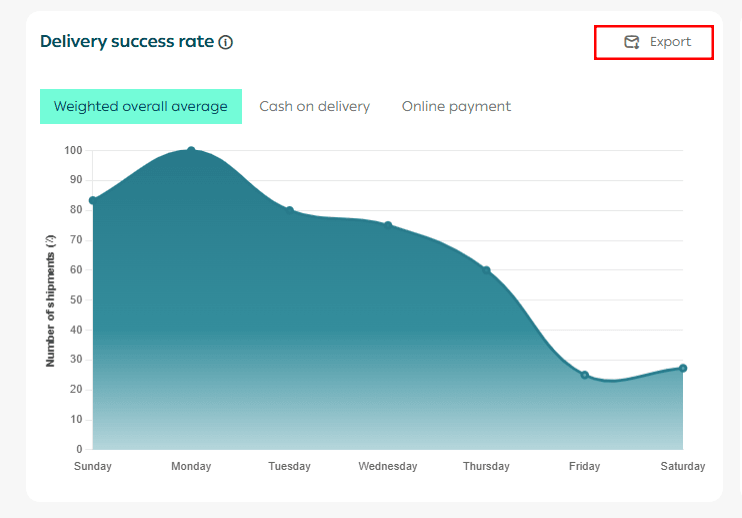
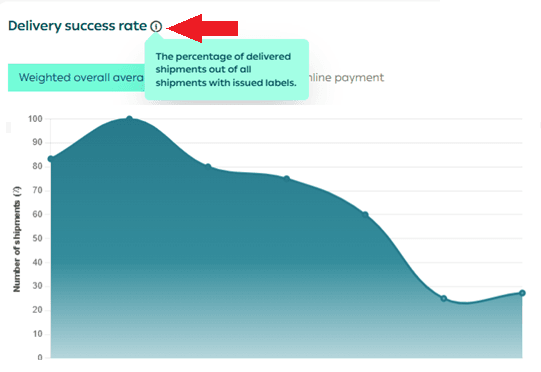
Shipment delivery success rate
Represents the number of successfully delivered shipments divided by the total number of shipments.
You can view:
- The overall average
- Cash on Delivery only
- Online payments and bank transfers
🔔 Important note: Cash on Delivery is currently available only for stores based in Saudi Arabia.
Average order cost
Represents the total logistics cost divided by the number of delivered orders.
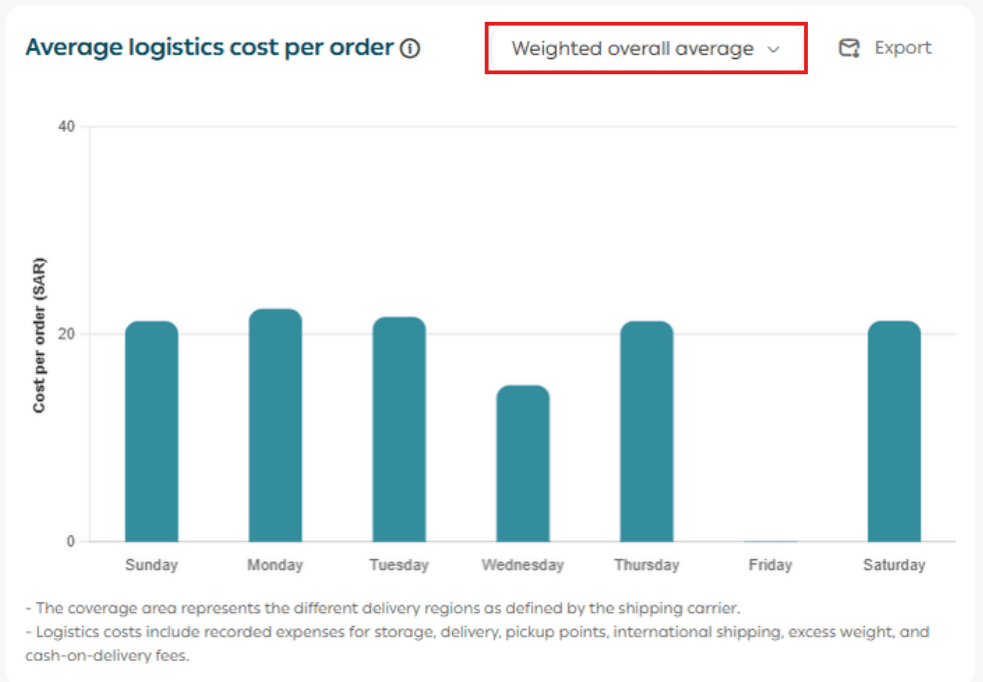
Coverage area
Reflects geographic delivery zones as defined by the shipping company.
Logistics costs include:
- Storage fees
- Delivery fees
- Payment gateway fees
- International shipping
- Excess weight charges
- Cash on Delivery fees, if applicable
You can view:
- The overall average
- Same city pickup and delivery
- Custom coverage areas
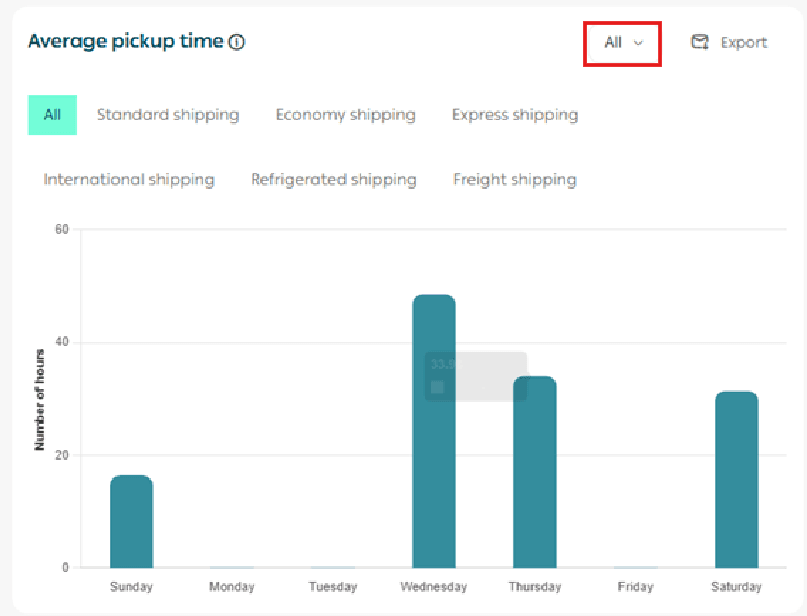
Average pickup time
The time between issuing the shipping label and the shipment being collected by the shipping company.
You can filter by:
- All shipment types
- Specific shipment types such as economy shipping
- All shipping companies or a specific company
Average delivery time
The time from shipping label creation until the customer receives the shipment.
You can view:
- Overall average
- Same city pickup and delivery
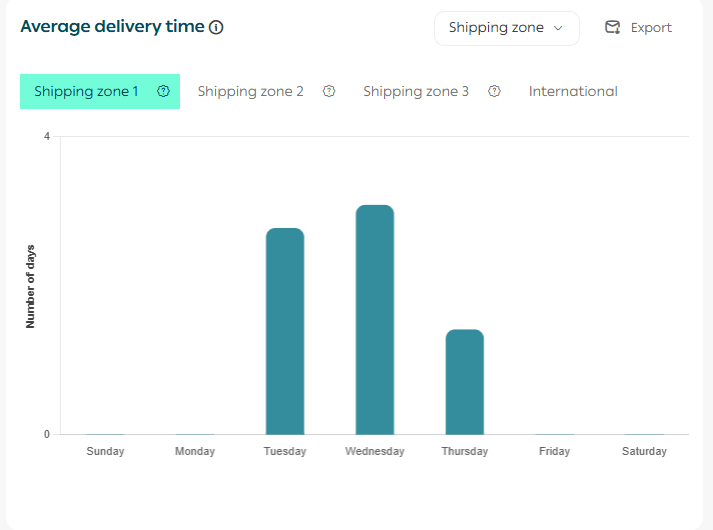
- Coverage area based analysis
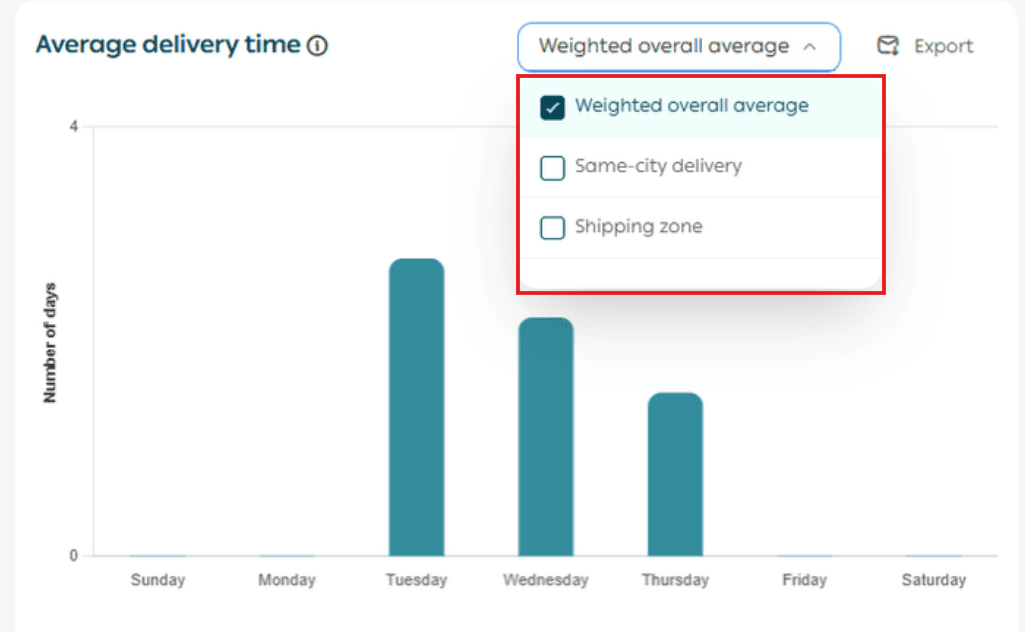
Coverage areas follow definitions provided by shipping companies.
💡 Example: Coverage Area 1

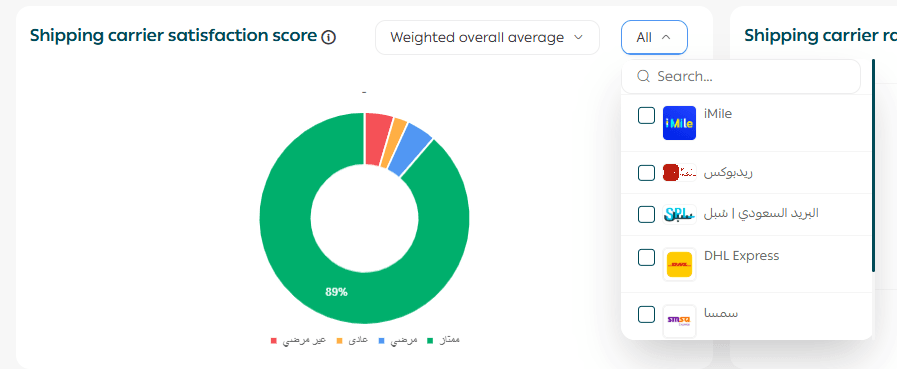
Customer satisfaction rate for shipping companies
Allows you to view:
- Overall customer satisfaction
- Same city pickup and delivery
- Custom coverage areas
This report provides a deeper analytical view of rating distribution rather than a single numeric score.
Rating categories include:
- Excellent
- Satisfactory
- Average
- Unsatisfactory
Each category is visually distinguished by color for easier analysis.
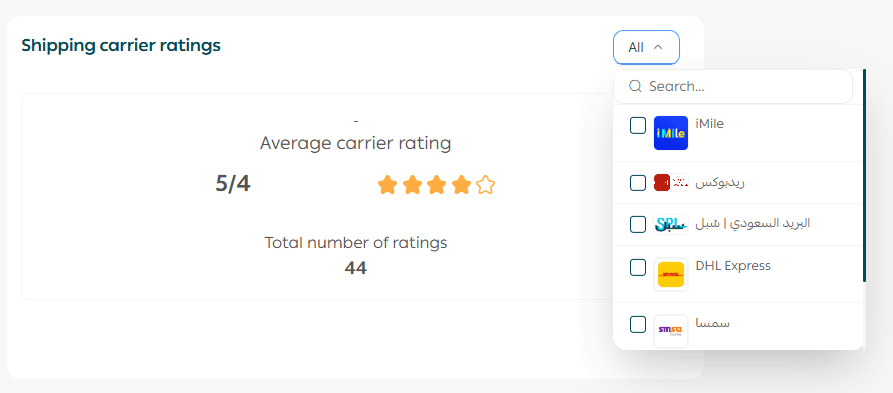
Customer ratings for shipping companies
Shows customer satisfaction ratings for the shipping experience overall or for specific shipping companies enabled in your store.
This report provides a fast, clear overview of how customers perceive each shipping provider.
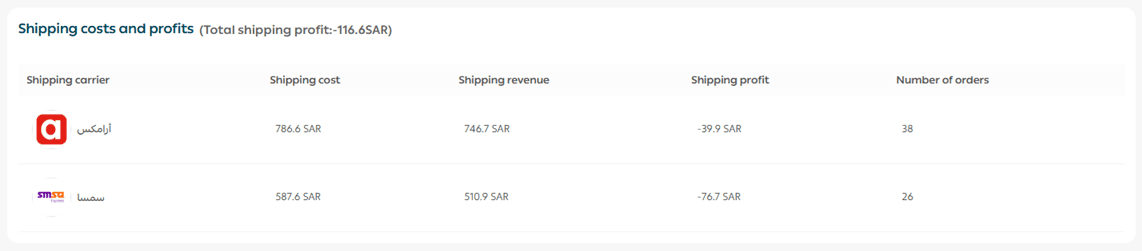
Shipping costs and profits
Displays shipping costs, shipping revenue, shipping profit, and number of shipped orders for each enabled shipping company during the selected period.
Calculation method:
Shipping profit = Shipping revenue minus Shipping costs
Shipping costs include:
- Delivery fees
- Payment gateway fees
- Cash on Delivery fees, if applicable
For more details, refer to:
- Payment method activation
- Shipping company setup within Salla Shipping Labels
Managing the shipping reports page
The Shipping Reports page offers advanced tools that allow you to build detailed, professional shipping analytics. Key features include:
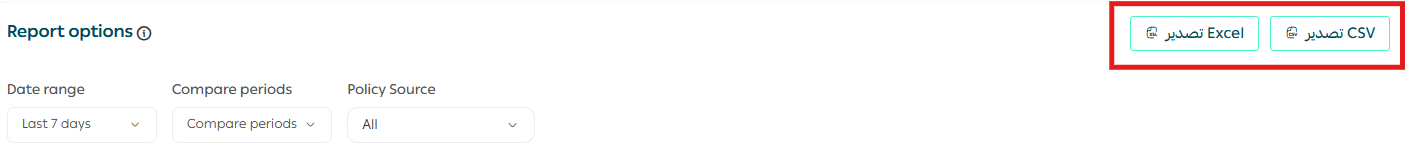
1. Report date controls
Select a time period
Choose a time range from a single day to multiple days or months.
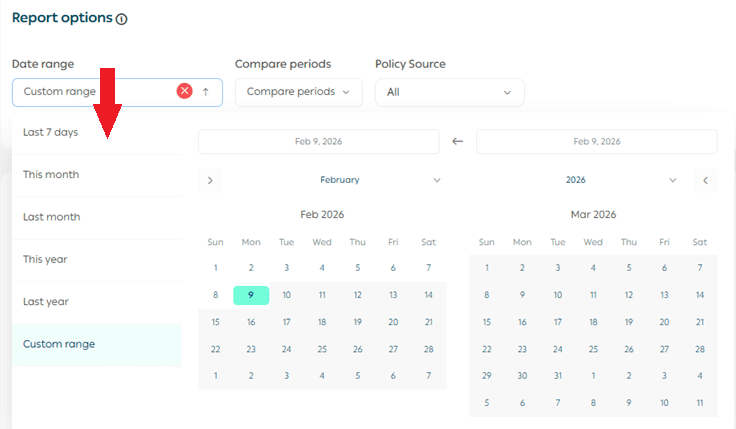
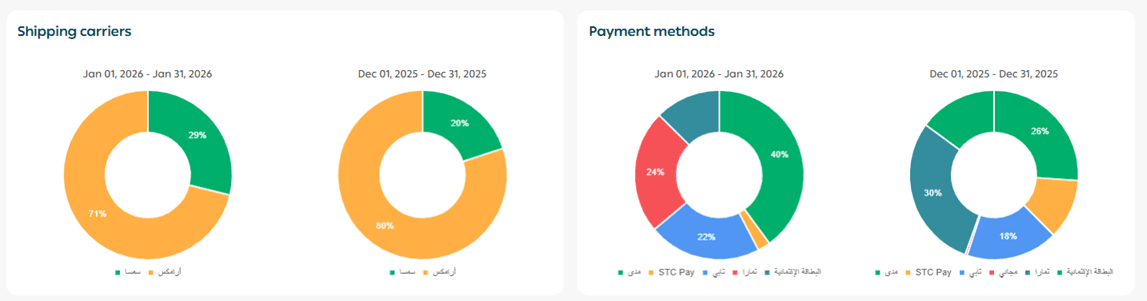
Compare two time periods
Click Compare periods, then select two different date ranges.
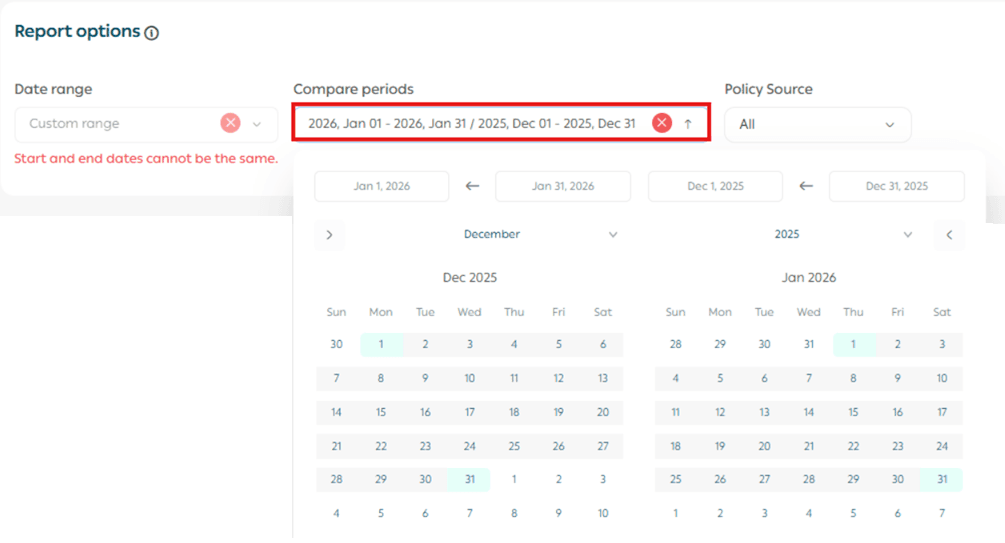
A comparison report will be generated automatically.
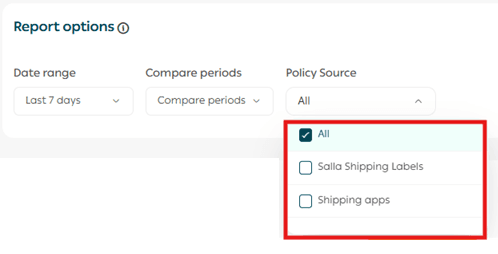
Shipping label source
Click Label Source, then select:
- All
- Salla Shipping Labels
- Shipping Apps
Export reports
You can export reports in Excel or CSV format using the export icon at the top of the page.

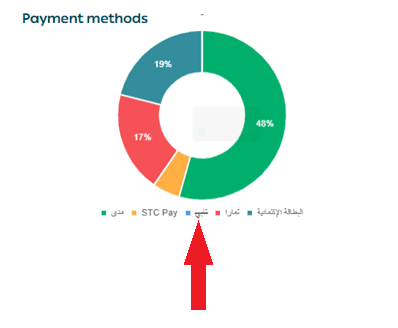
2. Exclude specific report components
You can exclude specific elements from certain reports by clicking on them.
💡 Example: Excluding Tapy from Payment report.
3. Export report results
Many shipping reports allow exporting detailed results.
Click Export Results, and the report will be sent to your store email.
4. Export profit analysis
Choose Excel or CSV, and the profit analysis report will be emailed to you.
5. Report data source explanation
Hover over the information icon (i) to understand the data source for each report.
Practical use cases for shipping reports
1️⃣ Improving shipment delivery success rate
Problem: A store noticed a high number of undelivered shipments, leading to increased shipping losses and returns.
Solution: By reviewing the delivery success rate report, the merchant discovered that Cash on Delivery orders had a 40 percent higher return rate compared to prepaid orders.
Result: The store added a small Cash on Delivery fee, encouraging prepaid payments and reducing returns by 25 percent within two months.
2️⃣ Reducing shipping costs and increasing profitability
Problem: The merchant was paying high shipping fees without understanding their impact on profits.
Solution: Using the shipping costs and profits report, the merchant identified a shipping company charging 20 percent more than competitors for the same service.
Result: After renegotiating rates or switching providers, shipping costs decreased and profit margins increased by 15 percent.
3️⃣ Improving customer satisfaction with shipping companies
Problem: Customers frequently complained about delayed shipments, but the cause was unclear.
Solution: The merchant reviewed customer satisfaction reports and identified one shipping company with consistently low ratings due to delivery delays.
Result: The merchant replaced the provider, improving customer experience and increasing repeat purchases by 18 percent.
4️⃣ Analyzing shipping performance by city
Problem: Some cities experienced repeated delivery delays, leading to cancellations and customer dissatisfaction.
Solution: Using pickup and delivery time reports, the merchant discovered weak shipping coverage in specific cities.
Result: Additional shipping providers were activated for those regions, reducing delivery times by 35 percent and increasing orders from those cities by 22 percent.