Do you know why your visitors reach your store — and where their journey breaks down before they buy?
Understanding customer behavior with Google Analytics shows you how people find your store, what they do once they arrive, and where the weak points in their journey sit. That knowledge is what turns guesswork into a growth strategy. In this guide, you'll learn what search behavior means, how to connect Google Analytics to your store, which metrics matter most, and how to customize your reports.
Google Analytics is a free analytics tool that tracks how visitors find and use your store. Connect it to your Salla store, then use the reports section to read real-time activity, audience demographics, traffic sources, engagement, and retention — and customize reports and comparisons around your business.
📌 Article overview
- What is search behavior?
- How to connect Google Analytics to your store
- The most important Google Analytics metrics
- Customize your reports on Google Analytics
- Frequently asked questions
🔍 What is search behavior?
With nearly 70% of searchers using Google, most store owners have every reason to care about Google's data. On top of the sheer volume of data it gives you access to, Google Analytics is also free — which makes it the natural first choice for site owners.
Search behavior is the set of actions a person takes when forming and typing a query into a search engine. Put simply, it covers the internal and external factors that shape how someone phrases the question they type into the search box.
💡 Example: imagine you're visiting Riyadh and want to buy a bouquet of flowers for your host in Diriyah. Using voice search, you ask: what is the best flower shop in Diriyah, Riyadh? The results look like this:
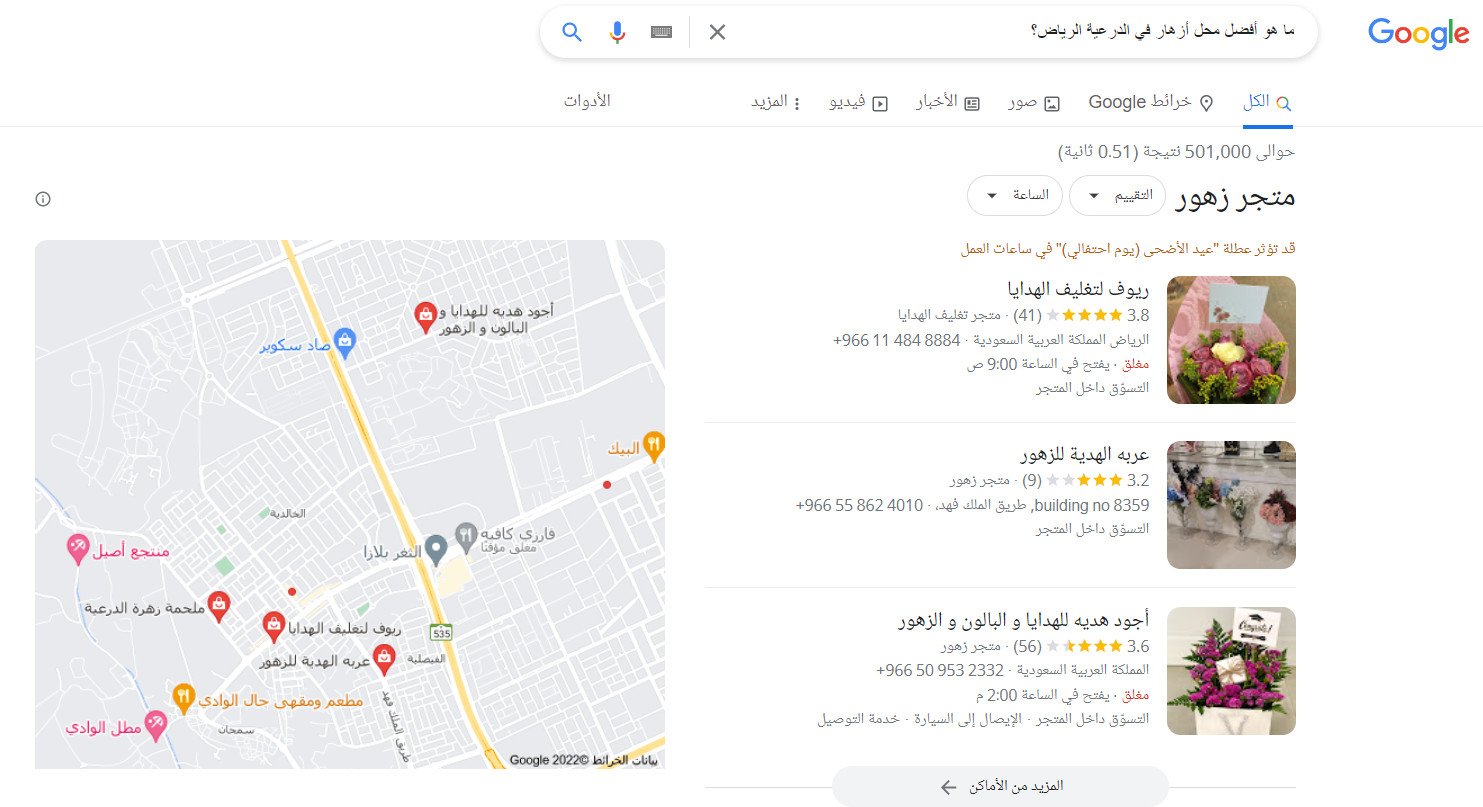
So what influences search behavior? Dozens of factors do, but the most useful ones from an SEO perspective are:
- Search intent — the reason behind the search, informational or transactional.
- Demographics — age, gender, location, income, and education.
- Technology changes — the rise of voice search and growing mobile usage.
- Language use — new terms like "smartphones," or shifts in everyday slang.
Apply those factors to the flower example above:
- The intent is both informational and transactional: the searcher wants an address and opening hours — hence adding "Riyadh" to the query — but is also ready to spend money.
- Demographics matter: an established professional is likely less price-sensitive and more likely to pick a shop based on reviews.
- Technology made it natural to use voice search in a conversational tone.
- The language included "Diriyah," which points to the destination.
Every one of those factors shaped how the search was phrased. You can spend hours writing and optimizing great content — but if you don't know why your customers reach your site, you're missing a large piece of the puzzle.
As a reminder, there are three main types of search intent:
- Navigational queries happen when the searcher wants a specific site — for example, searching for "facebook" or "amazon."
- Informational queries happen when the searcher wants answers or is researching a topic — for example, "how many Harry Potter movies are there."
- Transactional queries happen when the searcher wants to complete an action such as buying a product, finding a business address, or signing up for a service — for example, "best pizza in Dubai near me" or "how to check in for a Southwest flight."
So how do you work out the intent an organic visitor had when they found their way to your store? That is exactly where Google Analytics comes in.
🚀 How to connect Google Analytics to your store
Your potential customer moves through a sequence of steps before deciding to buy. To turn them from a visitor into a buyer — and then a repeat customer — you need to understand the shopping journey in your store, learn what interests them, and use those details to decide how to target them. Google Analytics, one of the largest analytics tools available, gives you that visibility.

For more details, see connecting Google Analytics to your store.
🎯 The most important Google Analytics metrics
Once the connection is complete, open the home page of your Google Analytics account and click (Reports).
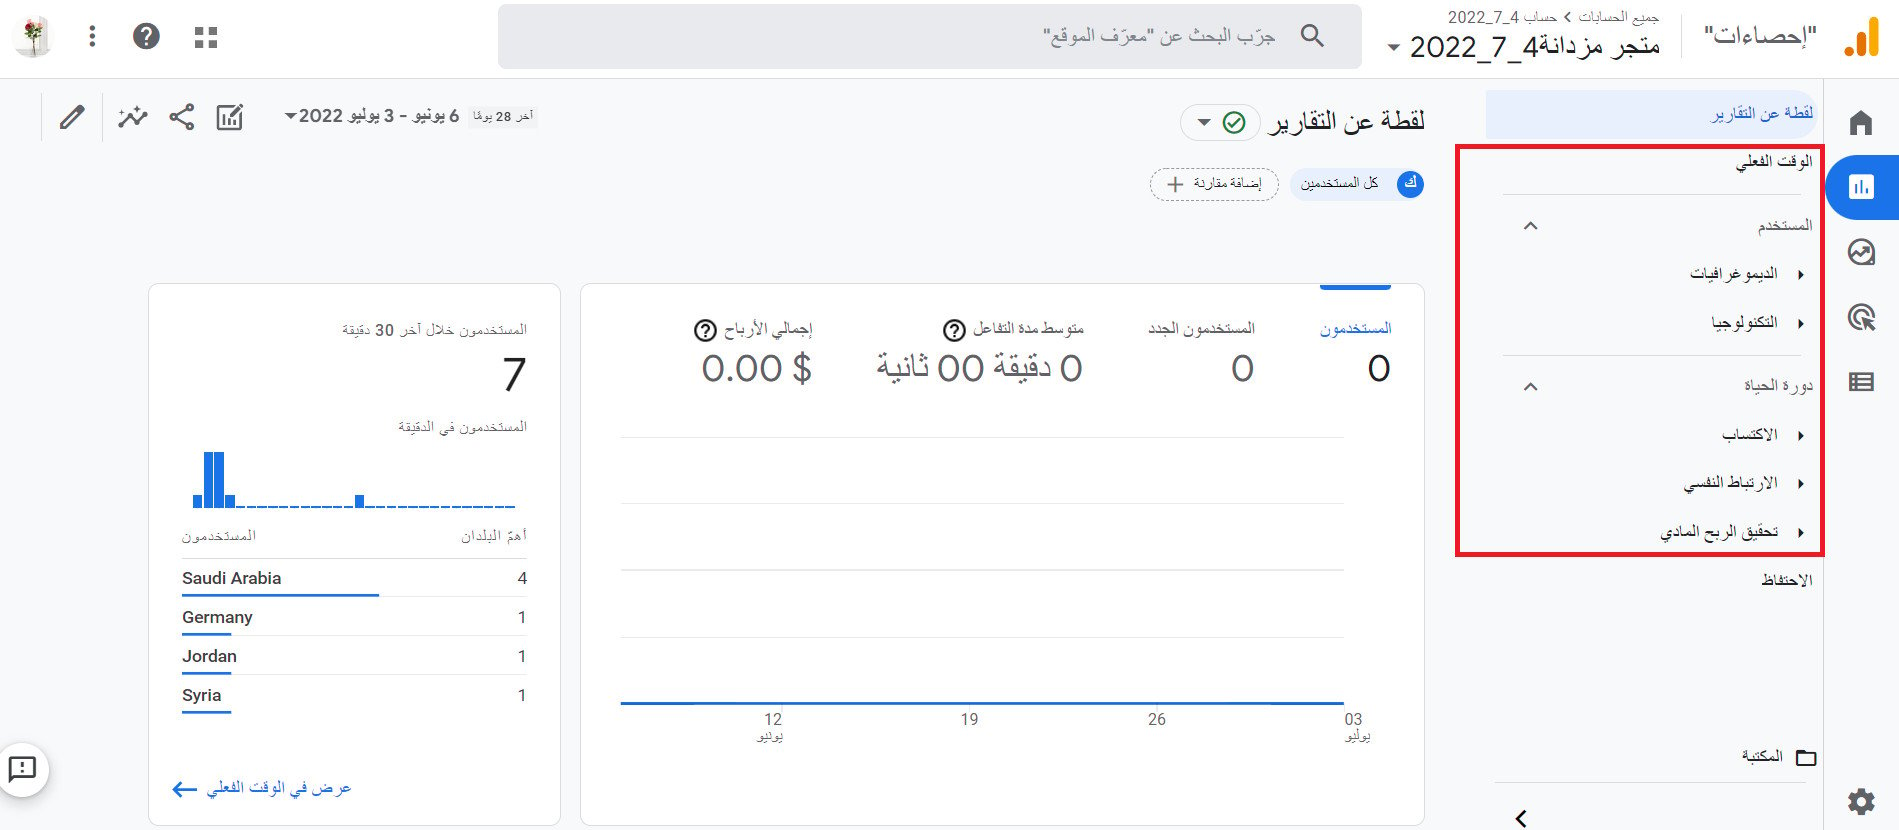
Google Analytics measures several groups of metrics. The most important are:
1. Realtime: instant data and statistics about your site.
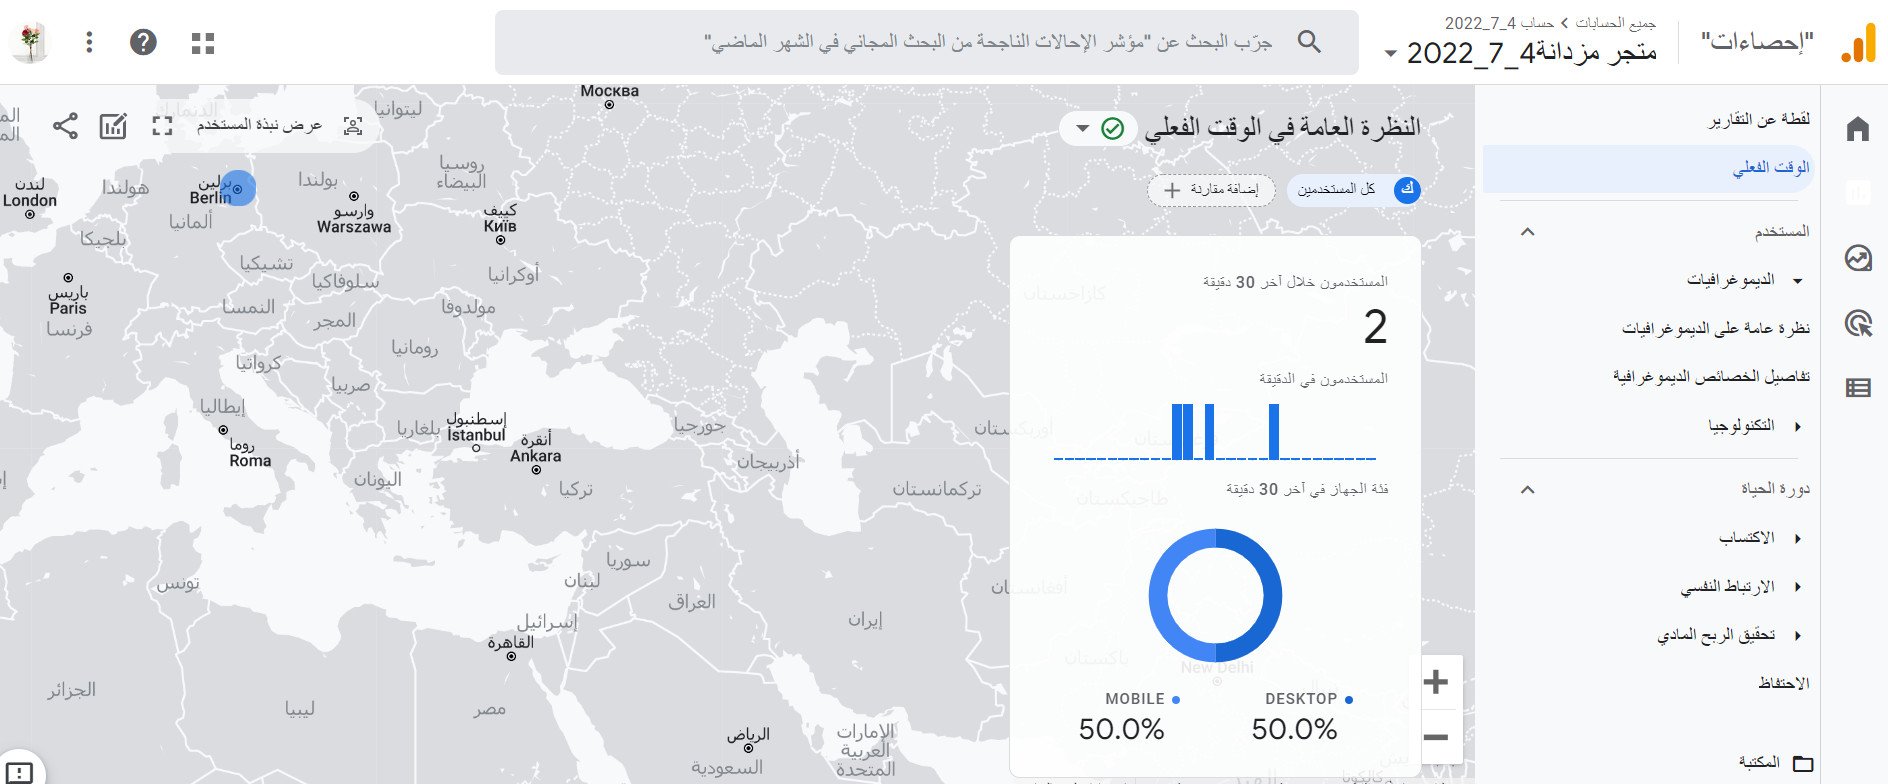
2. User: general metrics about your visitors.
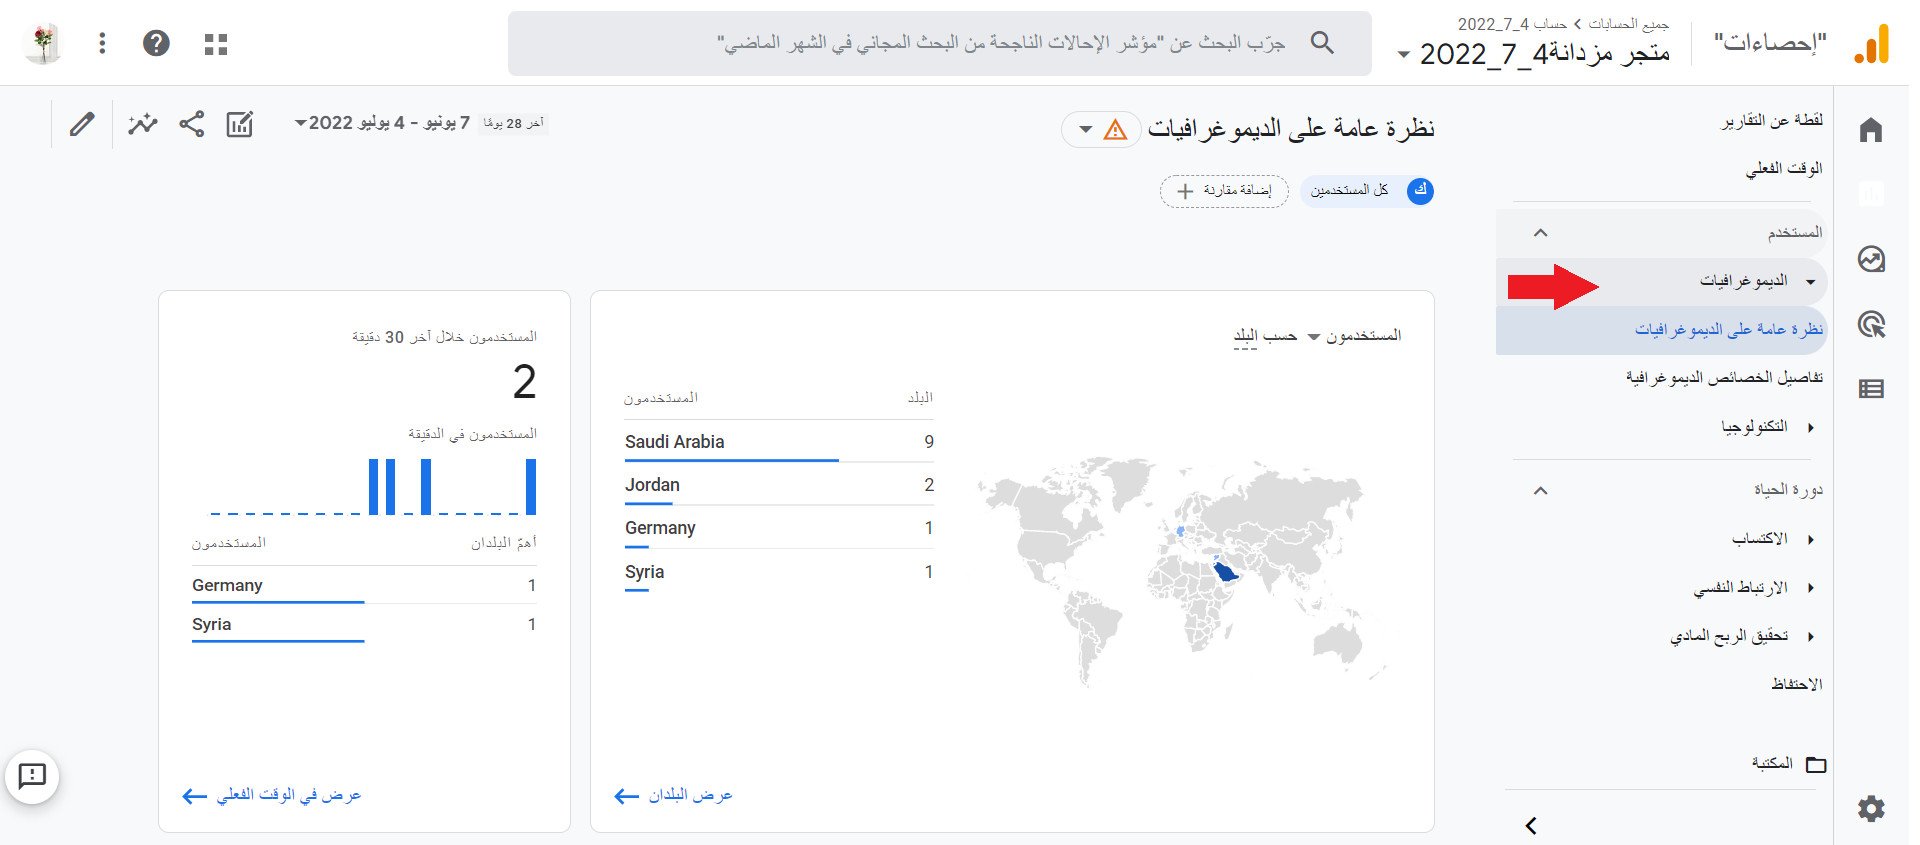
How to use audience demographics:
- Confirm you're attracting the right audience. A flood of visitors outside your ideal age or gender range can mean you're reaching — or writing content for — the wrong people.
- Check whether your current target audience is really the right one. The audience you think you're targeting may not be the one actually buying, or another audience may also want your product. Look at how each audience engages, not just visit counts — a high bounce rate, low time on site, or few pages per session can signal an uninterested audience.
- Make sure your site attracts the right geography. If you only serve one region but get heavy traffic from another, it may be time to rethink your marketing strategy.
- Spot potential hacks early. A sudden surge of traffic from another country can be a sign your site was compromised.
- Learn where your audience lives. If you serve an international or nationwide audience, this view helps you focus on the regions most interested in what you offer.
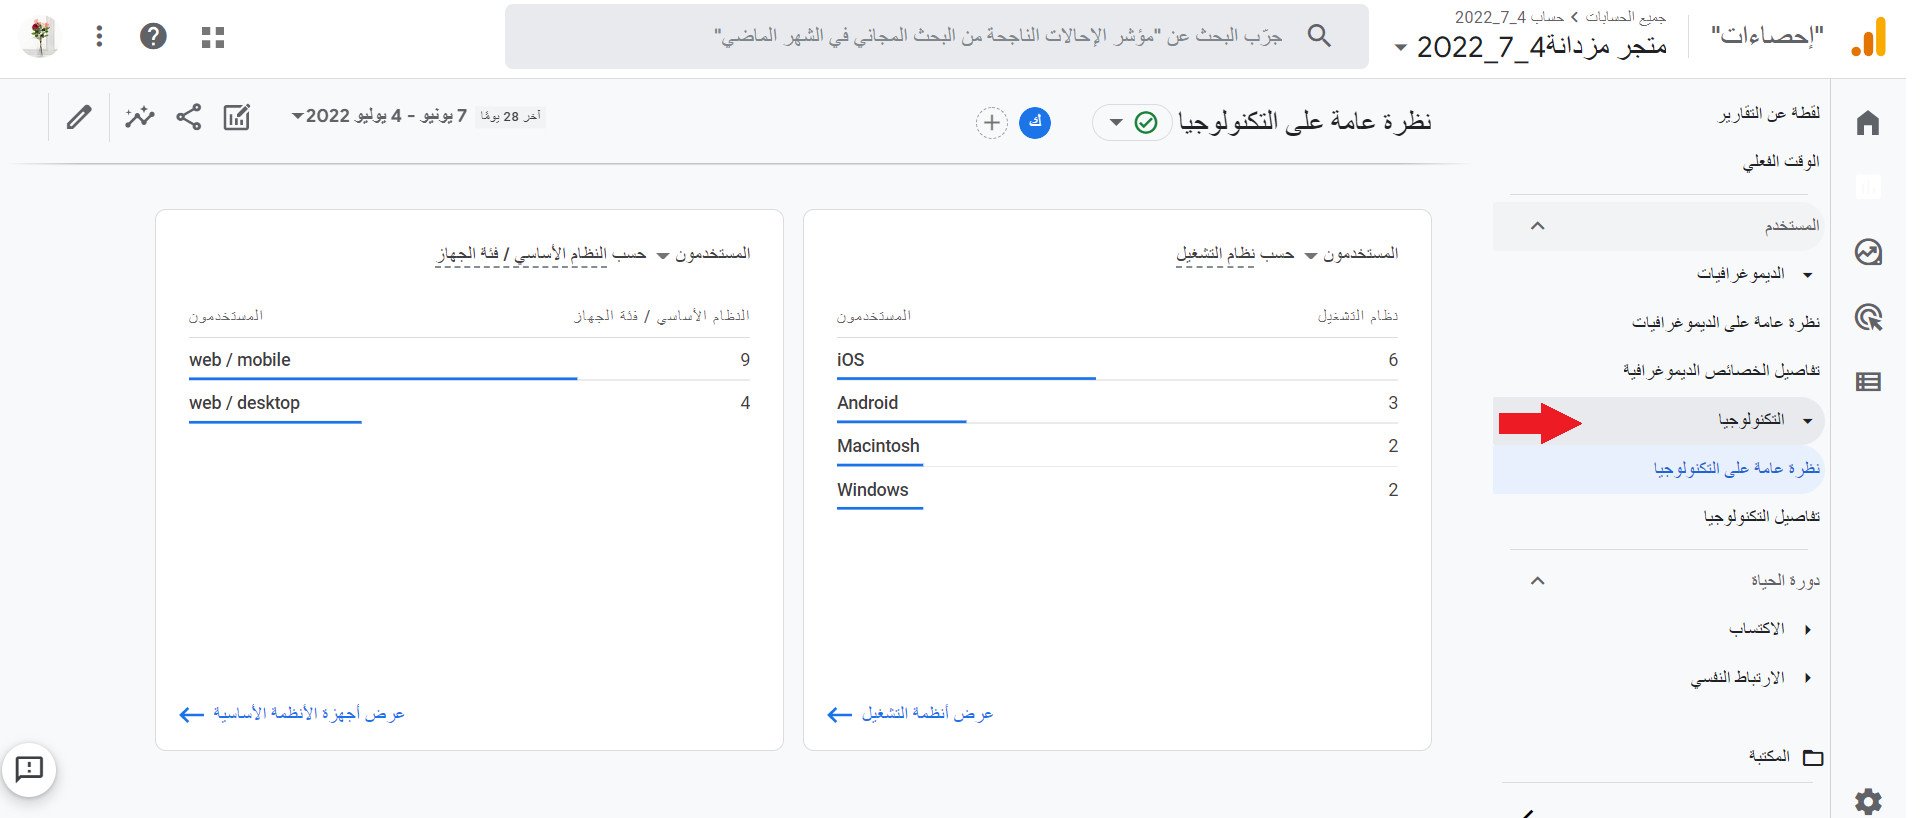
How to use the technology your audience uses:
- Prioritize improvements for the most-used browsers.
- Prioritize improvements for the most-used devices. With a little inference (or by opening the devices view), you can identify the devices visitors are most likely to use — then make sure your site loads fast and feels great on them.
- Identify browsers or devices with loading problems. An unusually high bounce rate on one browser is a red flag.
3. Acquisition: metrics that show where your traffic comes from.
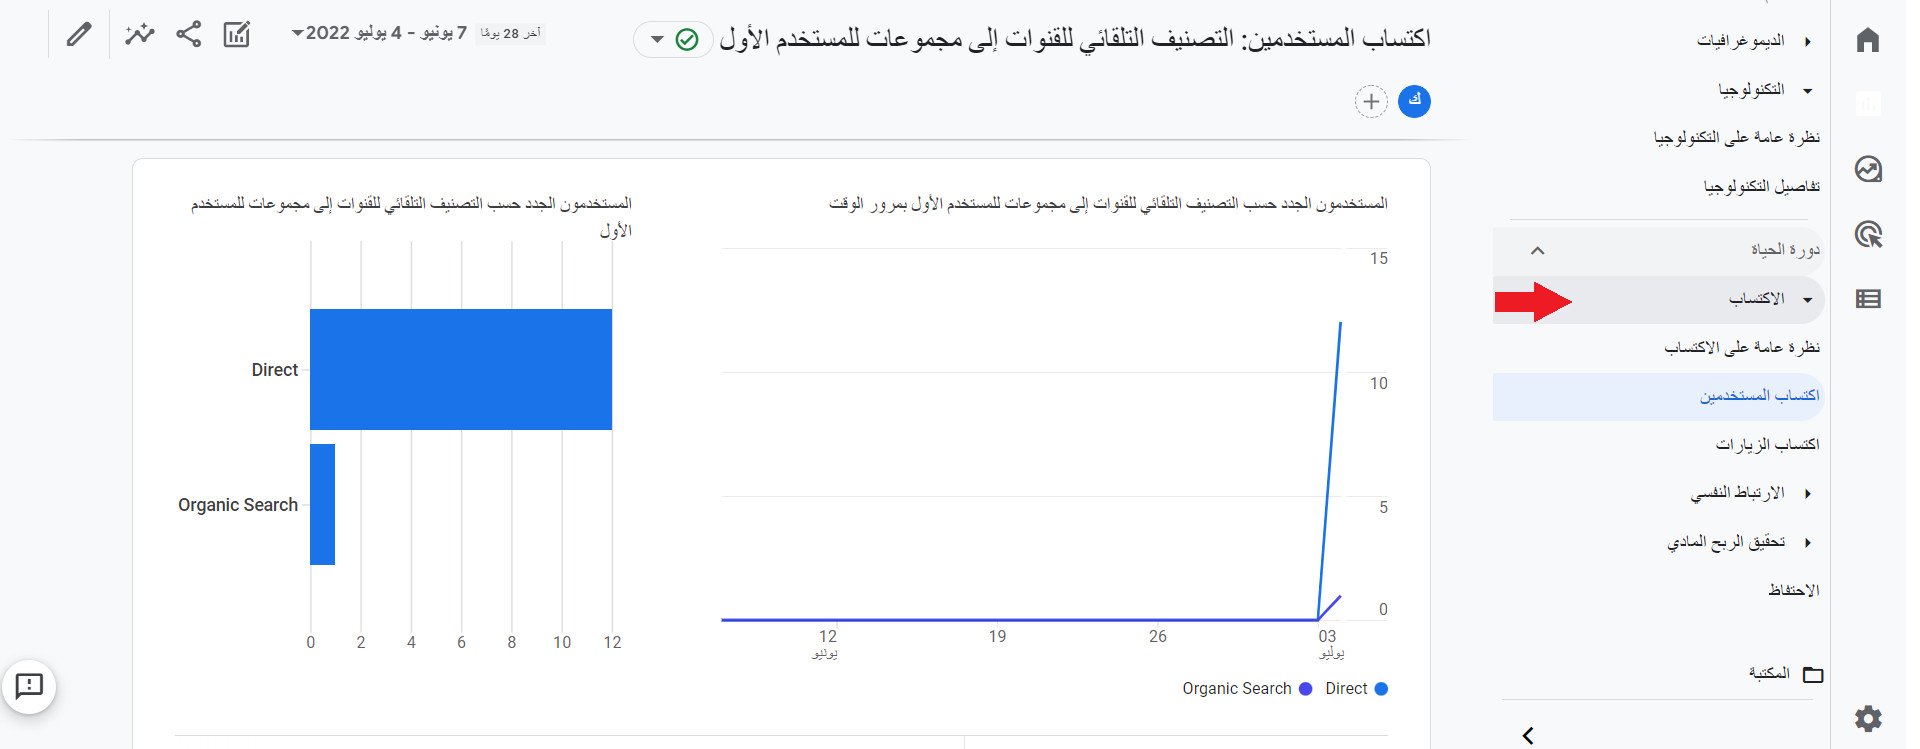
How to use this information:
- Find the marketing channels that bring the most visits.
- See how audiences from different channels engage with your site. If one channel drives weak engagement, review the message you're running there or the landing pages those users arrive on.
- Find your best-qualified, highest-converting channels — those are the ones worth investing in.
- Decide which marketing strategies to fund and which to wind down, based on each strategy's return on investment.
4. Engagement: metrics about how users behave while browsing your site.
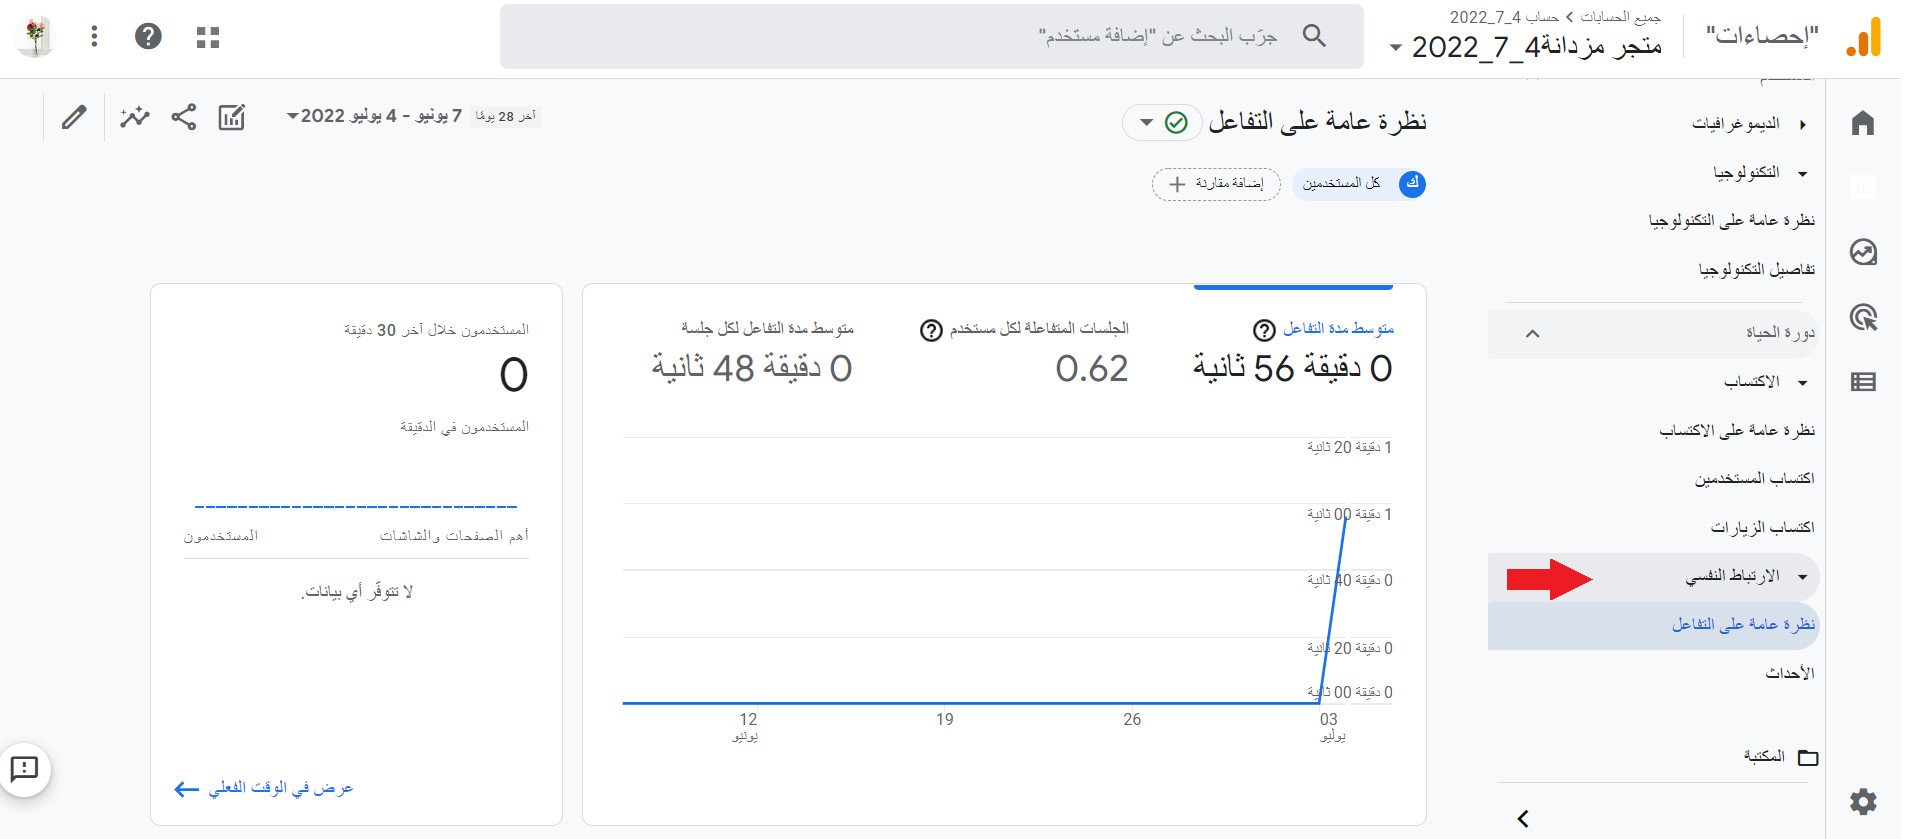
How to use this information:
- Look for patterns — if users convert more on certain days, concentrate your marketing on those days.
- Check whether your site actually completes the goals you set. If not, it may be time for some conversion rate optimization.
- Identify which marketing efforts drive conversions, so you know where your time and money work hardest.
5. Retention: metrics on how well you retain users.
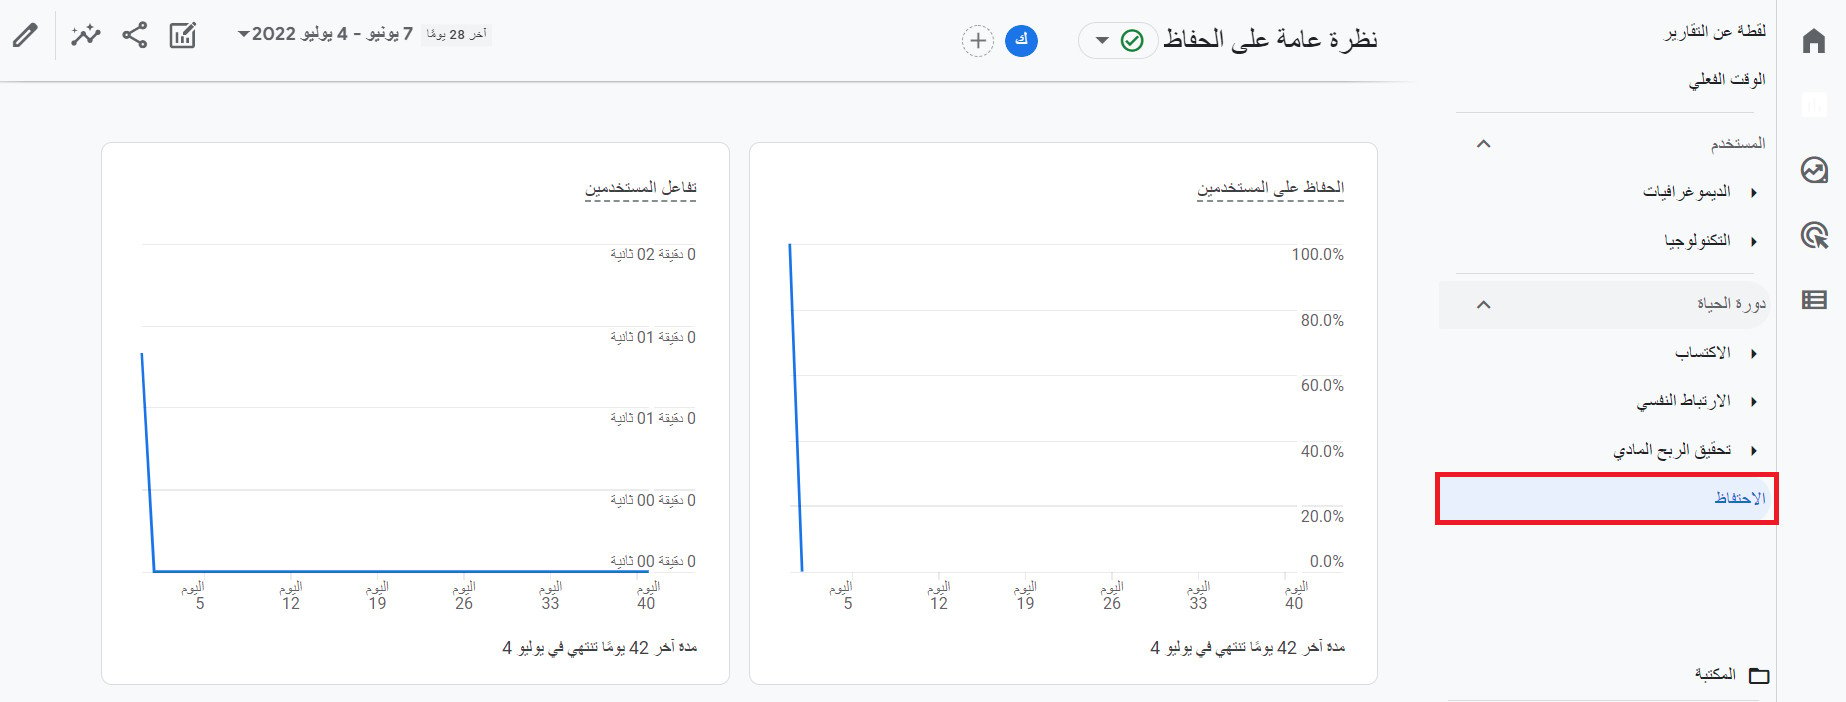
How to use this information:
- Retention shows how often, and for how long, users engage with your website or mobile app after their first visit.
- It also shows how valuable those users are, based on the additional revenue they generate after that first visit.
⚙️ Customize your reports on Google Analytics
You can start from the templates and setups some of the best analytics marketers use daily, then customize them further to fit your needs.
First: set the report's time period
This is useful for evaluating marketing campaigns and your SEO efforts over a defined window.

Second: customize the reports
From the control bar, click (Customize report).

Reorder the cards, or delete any card you don't need right now.
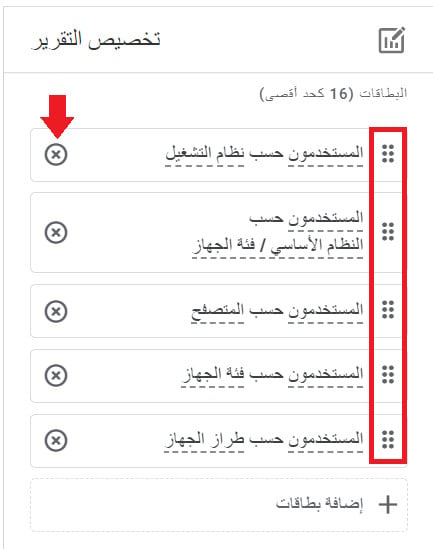
To add a new card, click (+ Add cards).
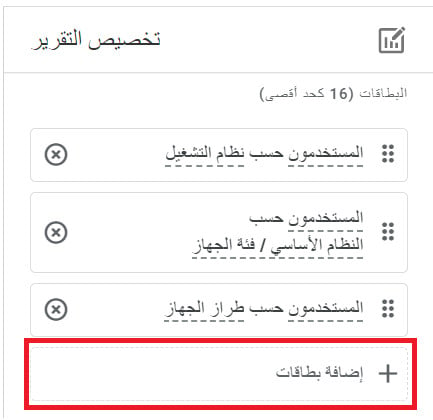
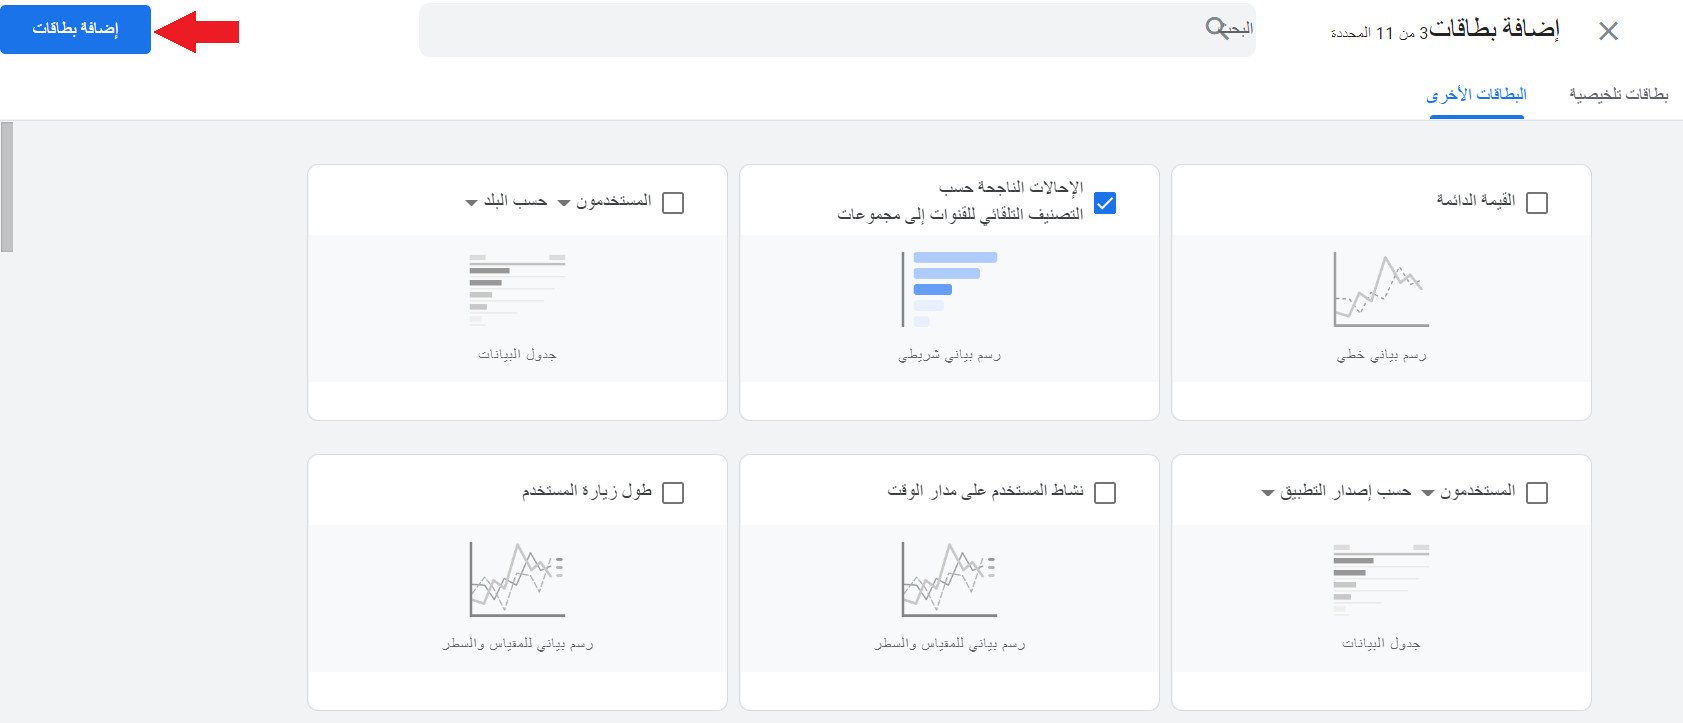
Select the cards that fit your business from the (Summary cards) and (Other cards) tabs, then click (Add cards).
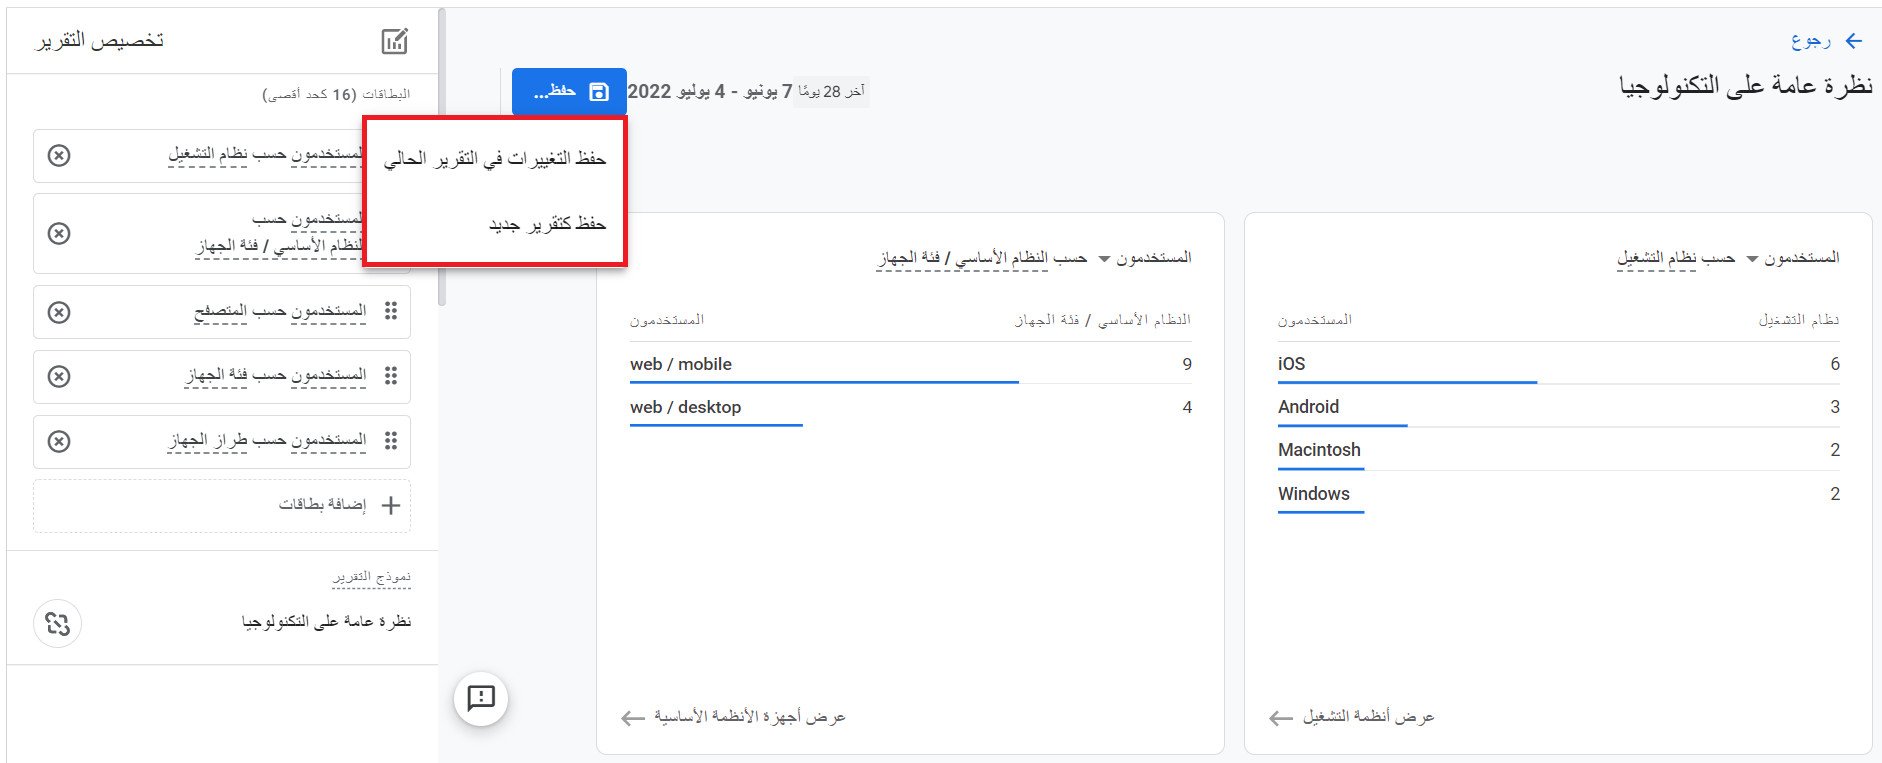
Finally, click (Save) and choose whether to save the changes to the current report or save them as a new report.
Third: create comparisons
1. To add a new comparison, click (+ Add comparison).

2. Choose whether the dimension should be included in or excluded from the report.
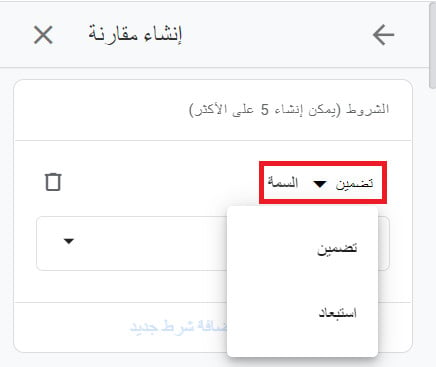
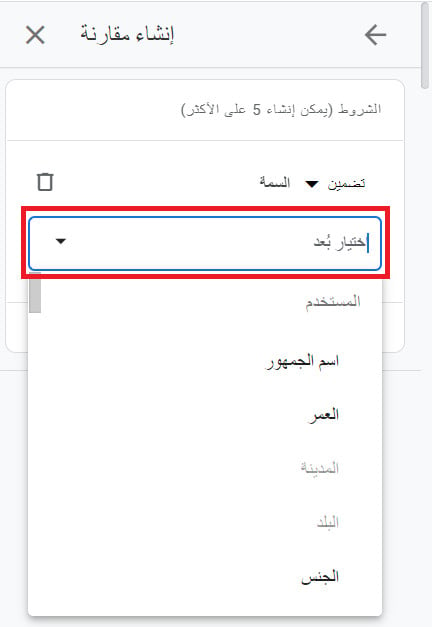
3. Pick the dimension to include or exclude from the list.
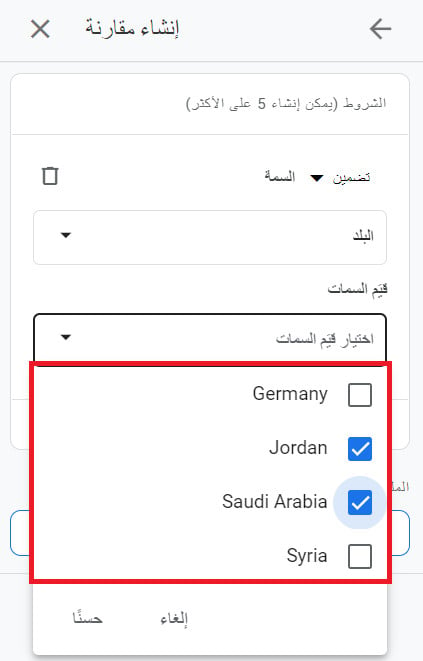
4. Set the dimension's value, then click (OK).
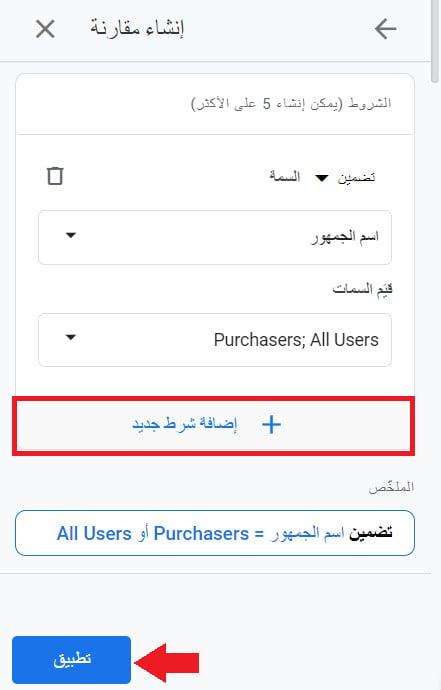
To add another condition, click (+ Add new condition). After adding all your conditions, click (Apply).
📝 Important notes
You can add up to 5 conditions per comparison.
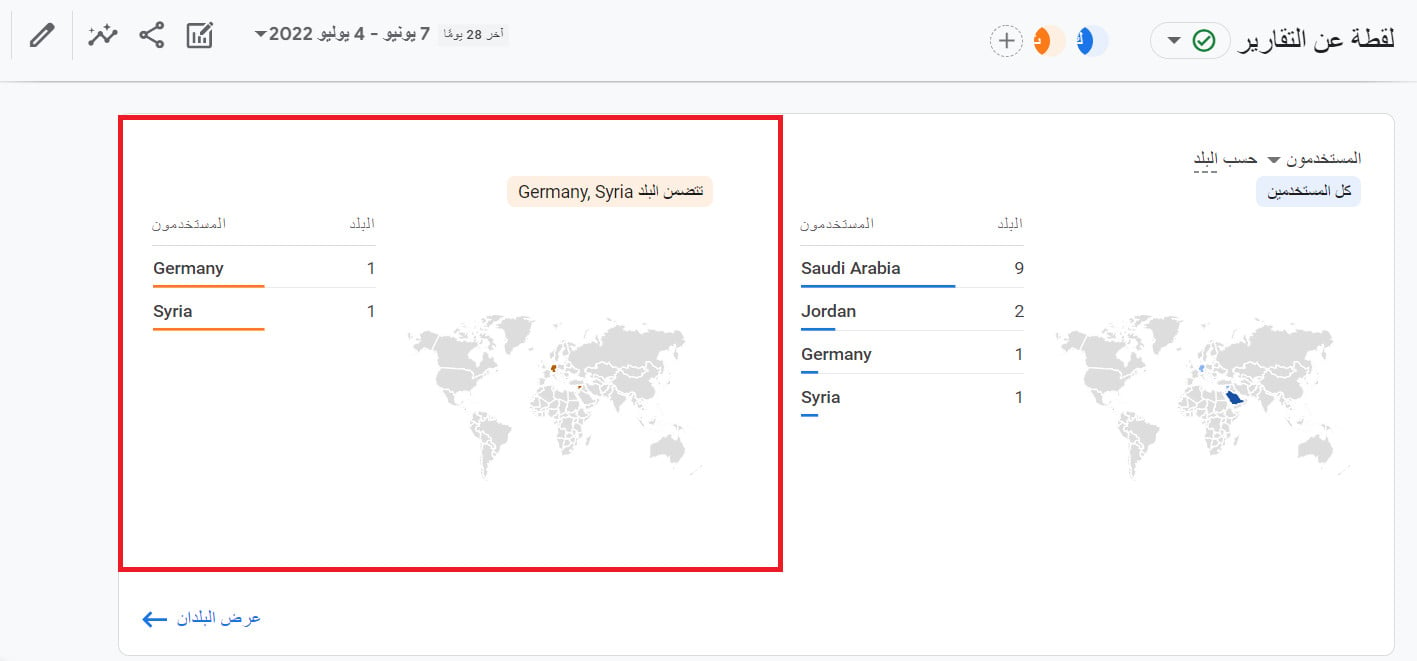
The comparison then appears across all your reports, like this:
❓ Frequently asked questions
What does organic search mean in acquisition reports?
47% of consumers view 3-5 pieces of content before talking to a sales representative. On top of that, 51% of all website visits come from organic search, and more than 40% of revenue is captured through organic traffic. That is why organic search matters: it builds your brand, drives sales, and delivers value to your audience.
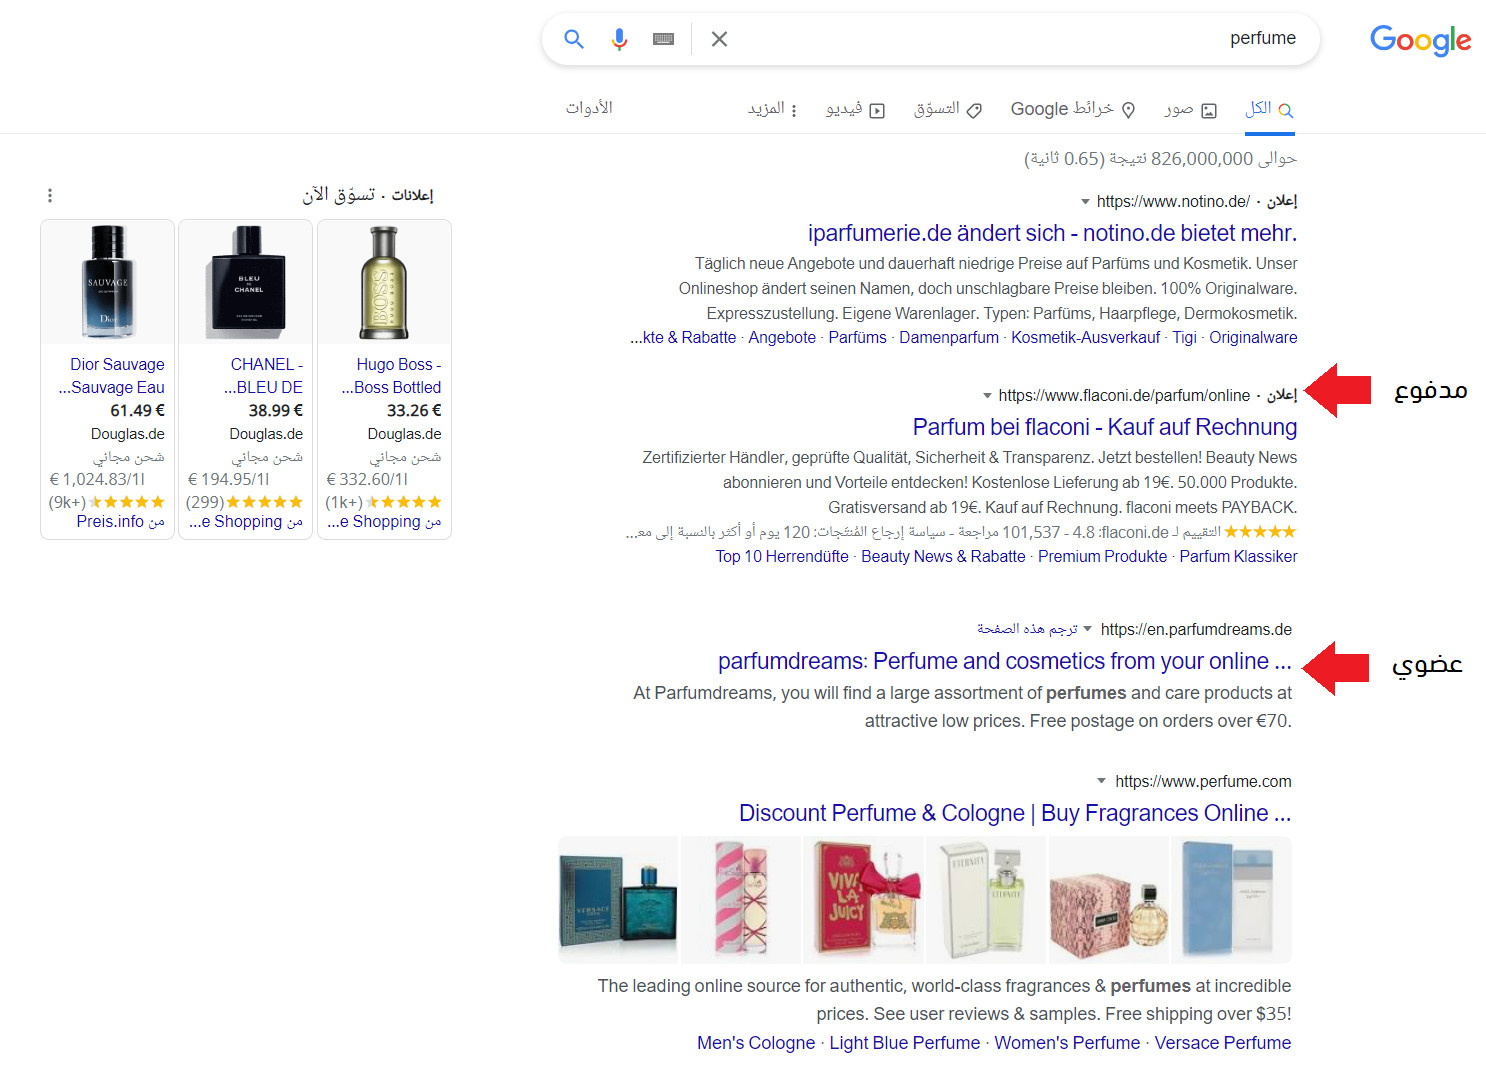
Organic search refers to search engine results that paid ads cannot influence. Organic results are ranked by how relevant they are to the search term.
💡 Example: search for "perfume" and the first results are paid ads, followed by the organic (ad-free) results.
A variety of factors can influence organic ranking, including:
- Internal and external link structure
- Technical factors (such as URL length and load times)
- Content quality and structure
- Optimization through media such as video and images
- HTTPS encryption
Can I share my statistics?
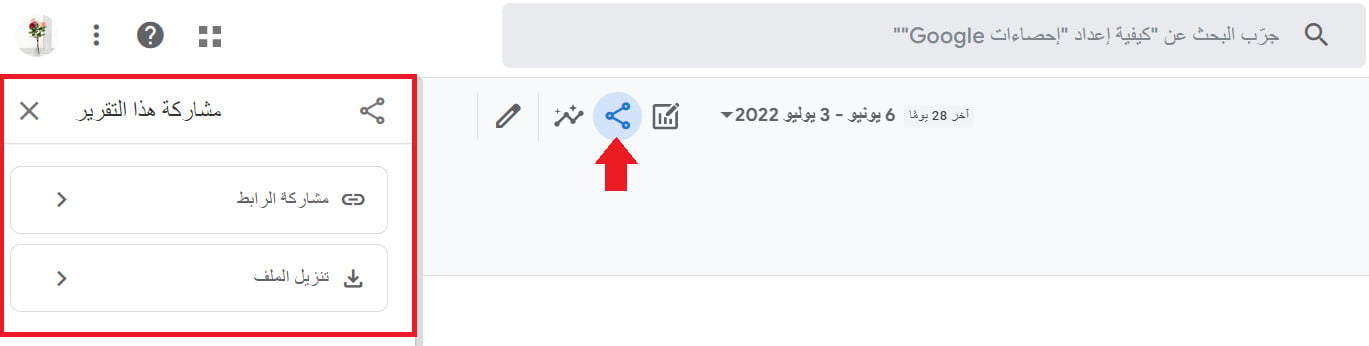
Yes. Click (Share) — a window opens that lets you share a link or download the statistics as a file for whoever you want to share them with.
Can I create a new report collection?
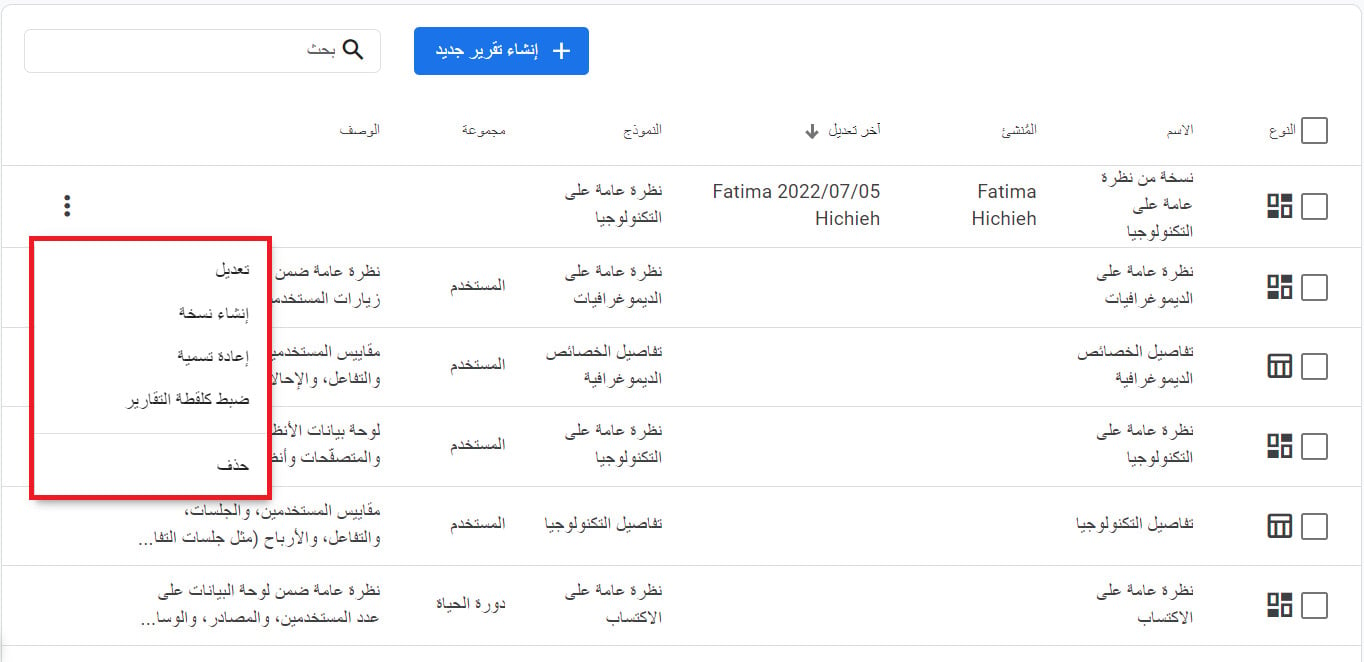
Yes. Google Analytics lets you create new collections and new reports — click (Library).
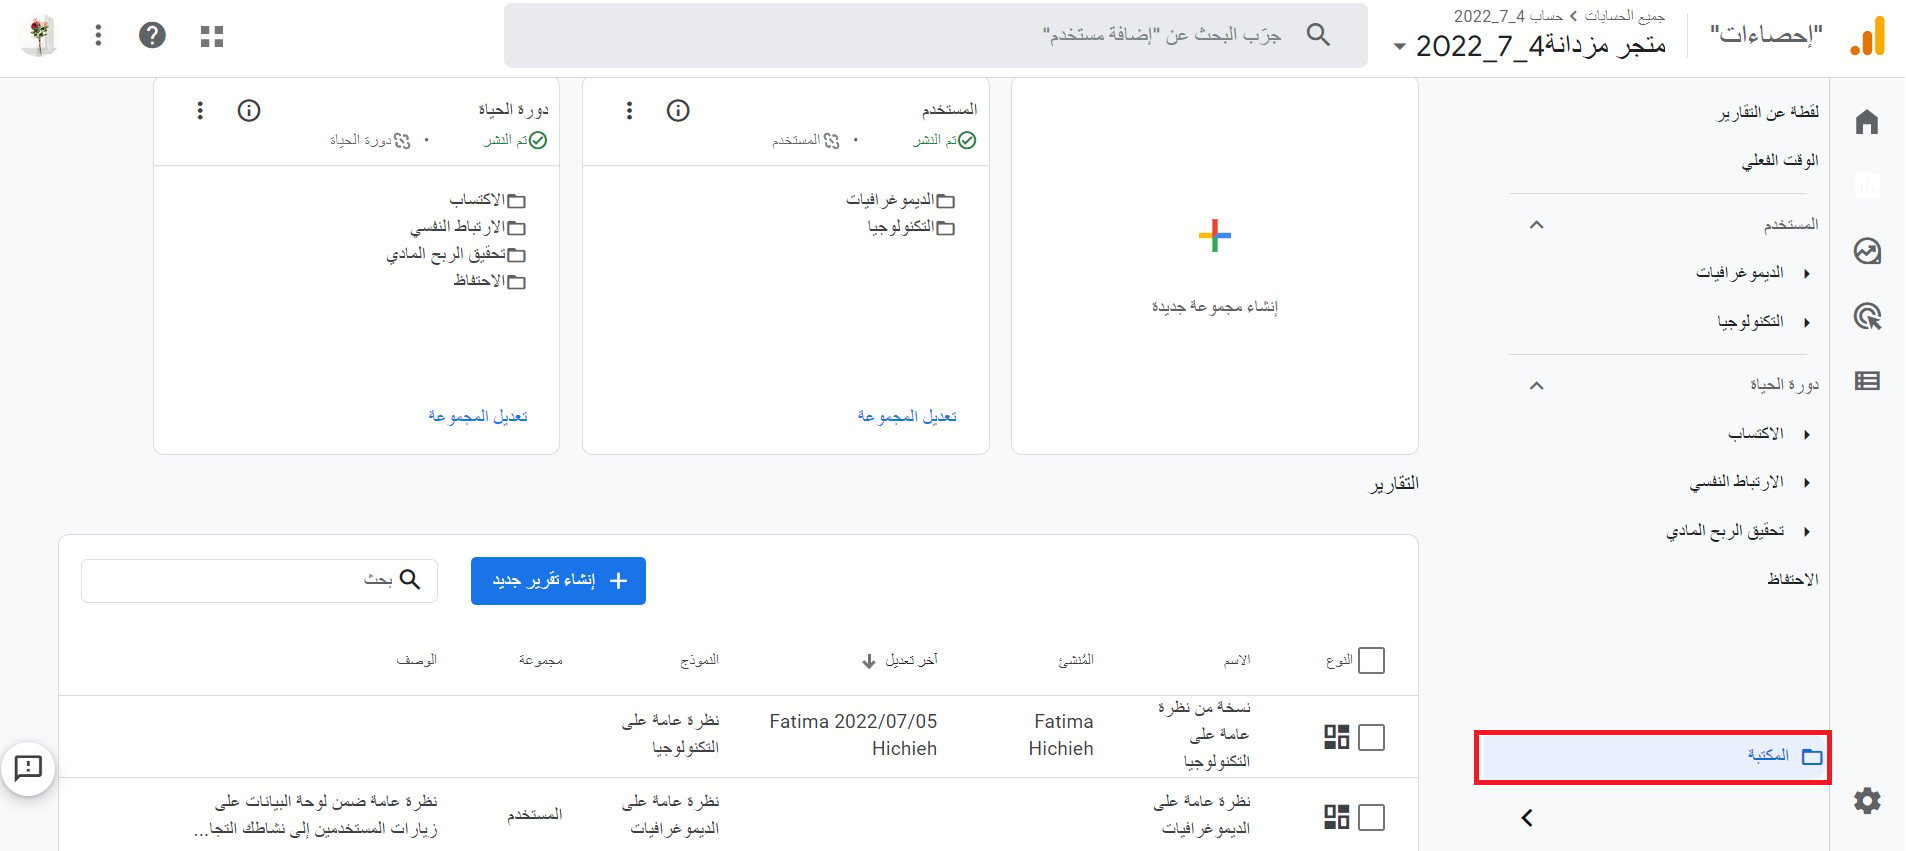
From the library, you can also delete the reports and collections that no longer interest you, among other controls.
Read your visitors before you try to convince them. The store that understands why people arrive — and where they drop off — is the store that knows exactly what to fix next.