Do you know how many people saw your app on the App Store this month — and how many of them actually downloaded it?
Apple's App Analytics shows you exactly how your iOS app is performing: impressions, product page views, downloads, conversion rate, revenue, sessions, and crashes. In this guide, you'll learn how to open App Analytics from your Apple Developer account, read the Overview metrics, and break results down by date, territory, source, and device.
To view your app's App Analytics, sign in to your Apple Developer account, click Program resources, then choose Analytics — or click App Analytics from any App Store Connect page. Select your app to see its impressions, page views, conversion rate, downloads, proceeds, sessions, and crashes for the last 30 days.
📌 Article overview
- How to open App Analytics
- What the Overview metrics mean
- Frequently asked questions
👣 How to open App Analytics
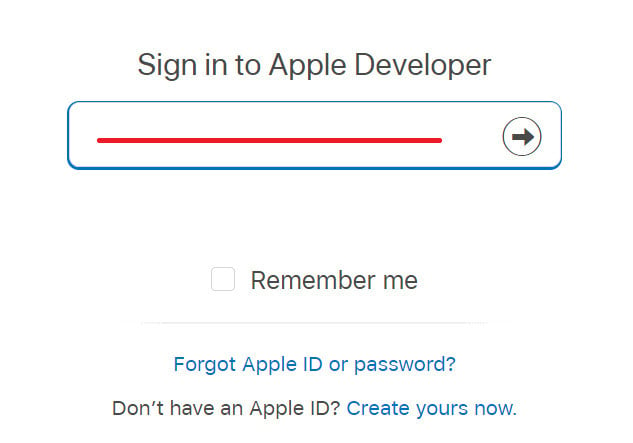
1. Sign in to your developer account in the Apple Developer Program at Account - Apple Developer. Enter your registered email and password; at this stage you may be asked for the verification code Apple sends to your registered mobile number.
For more details, see creating an Apple developer account as a company or organization.
For more details, see creating an Apple developer account as an individual.
For more details, see creating an Apple developer account from the mobile app.
2. Click (Program resources), then choose Analytics.
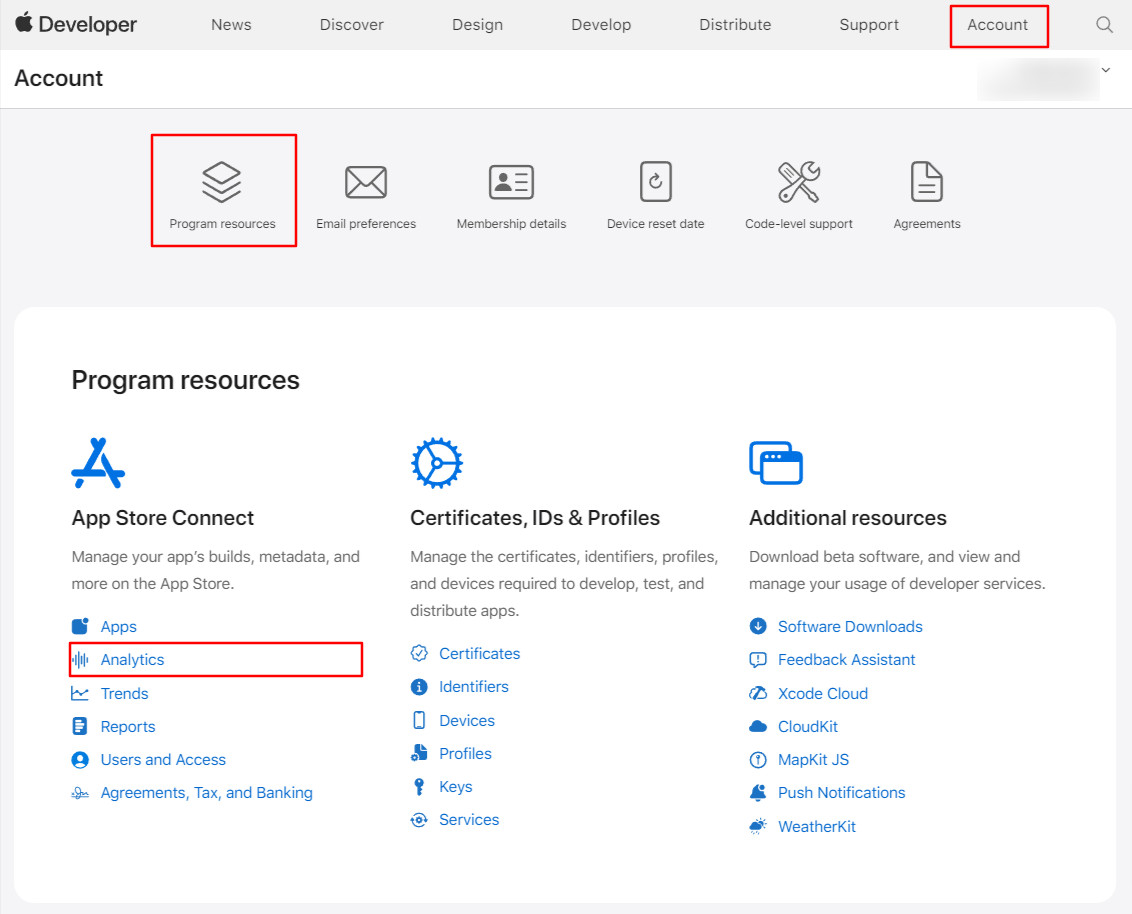
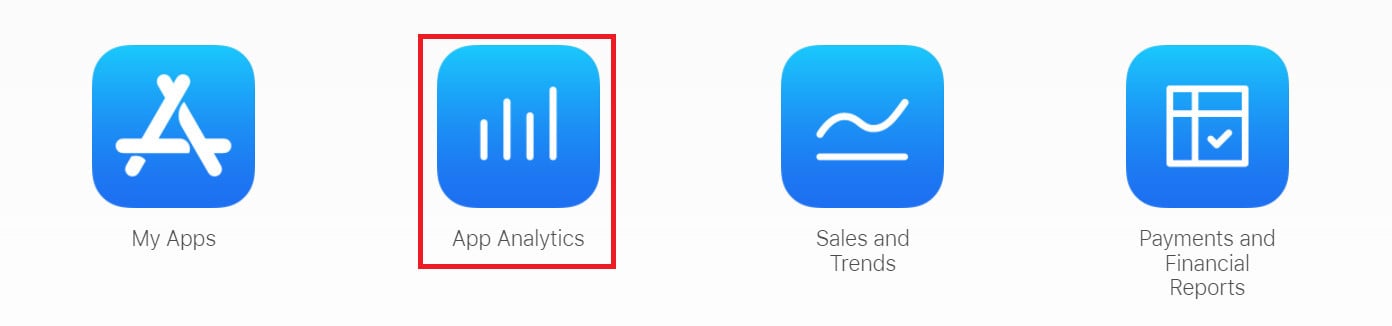
Alternatively, from any App Store Connect page, click (App Analytics).
3. All the apps in your account appear, each with brief statistics next to it. Click the app you want.
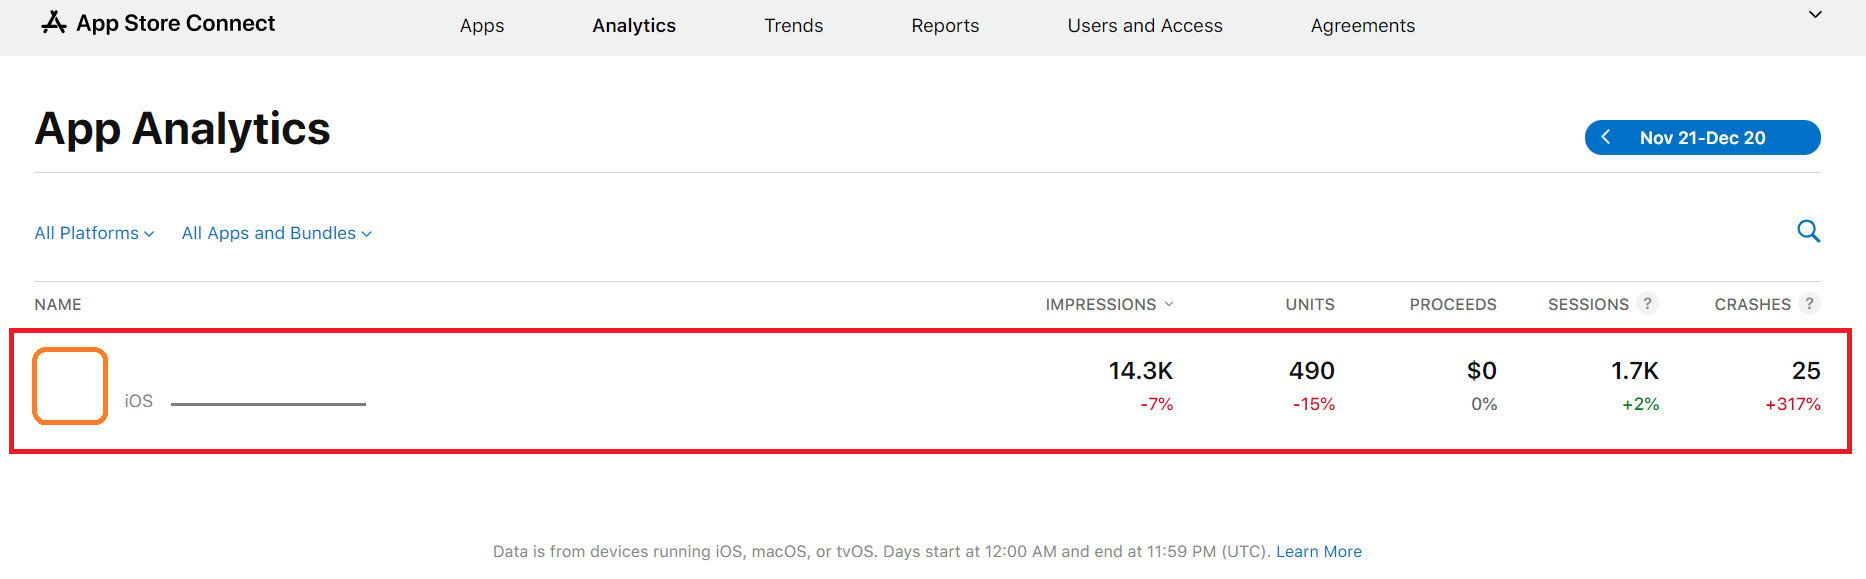
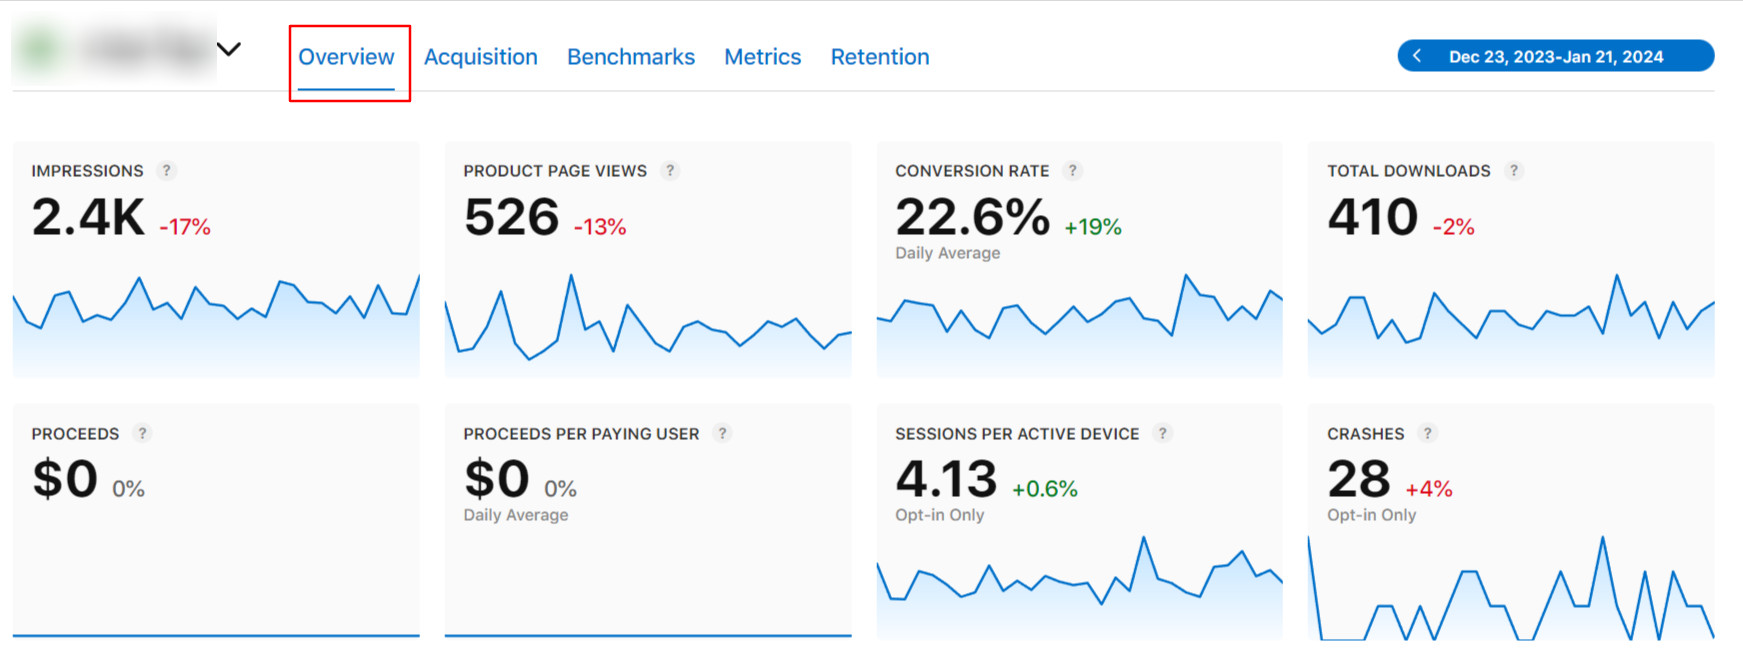
The app's summary statistics for the last 30 days appear like this:
🎯 What the Overview metrics mean
The most useful page for tracking your app's statistics is the Overview page, which includes several categories:
- Impressions: how many times your app was seen
- Product Page Views: views of your app's App Store page
- Conversion Rate: the share of viewers who download
- Total Downloads: all downloads of your app
- Proceeds: your revenue (relevant to paid apps)
- Proceeds per Paying User: revenue per paying user
- Sessions per Active Device: daily average sessions per active device
- Crashes: the number of issues users hit that caused the app to close
In addition to the other sections:
- A map of where your app is used worldwide
- The sources your app's users came from
- The device types your app is used on
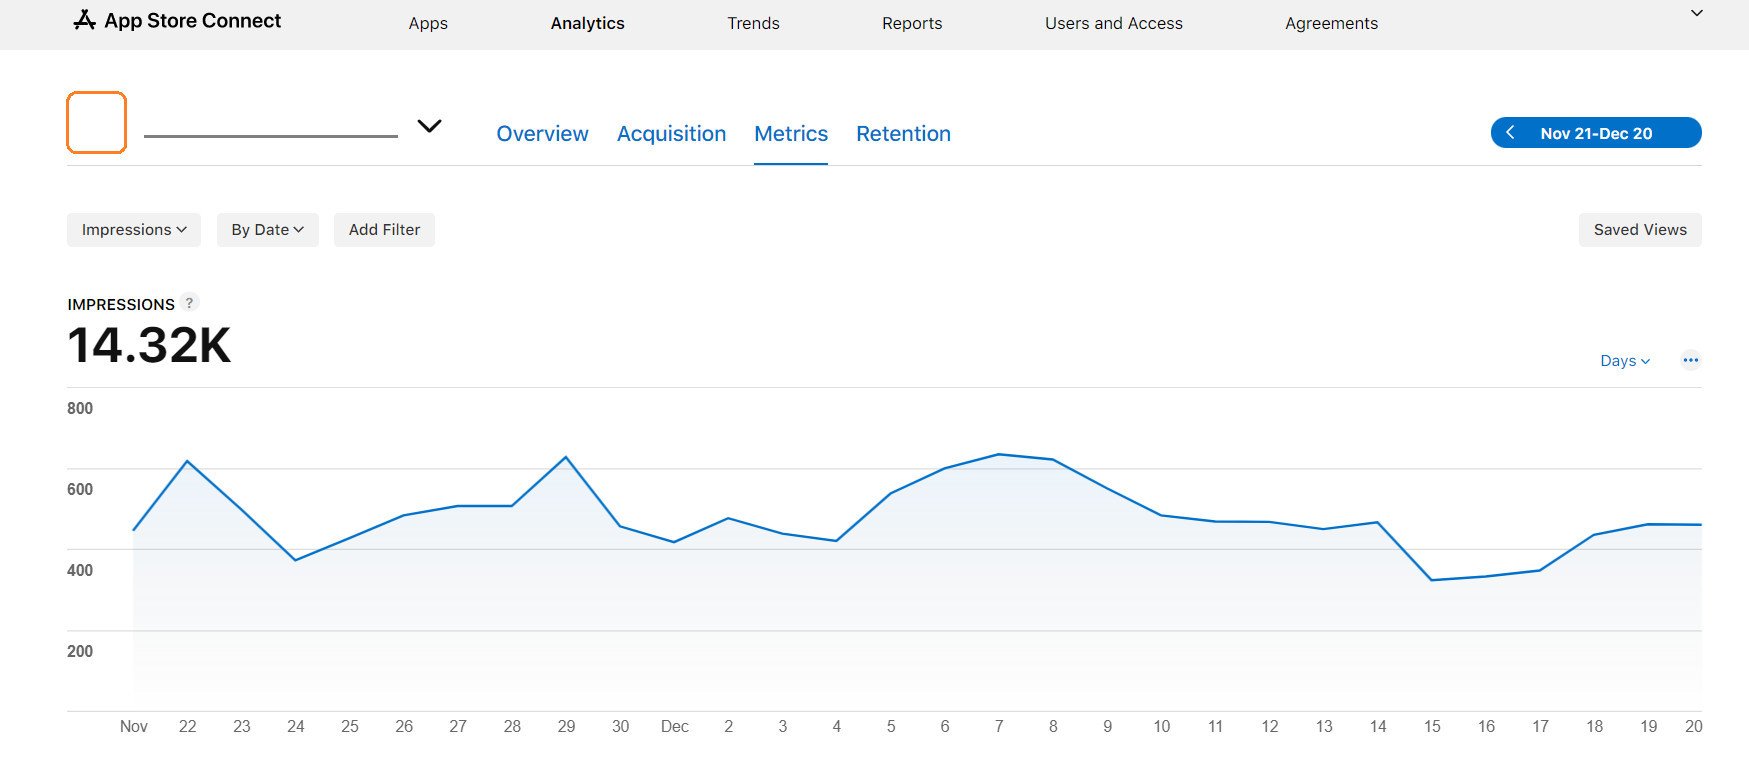
Click any statistic to see more detail about it — for example, the details behind (Impressions).
📝 Important notes
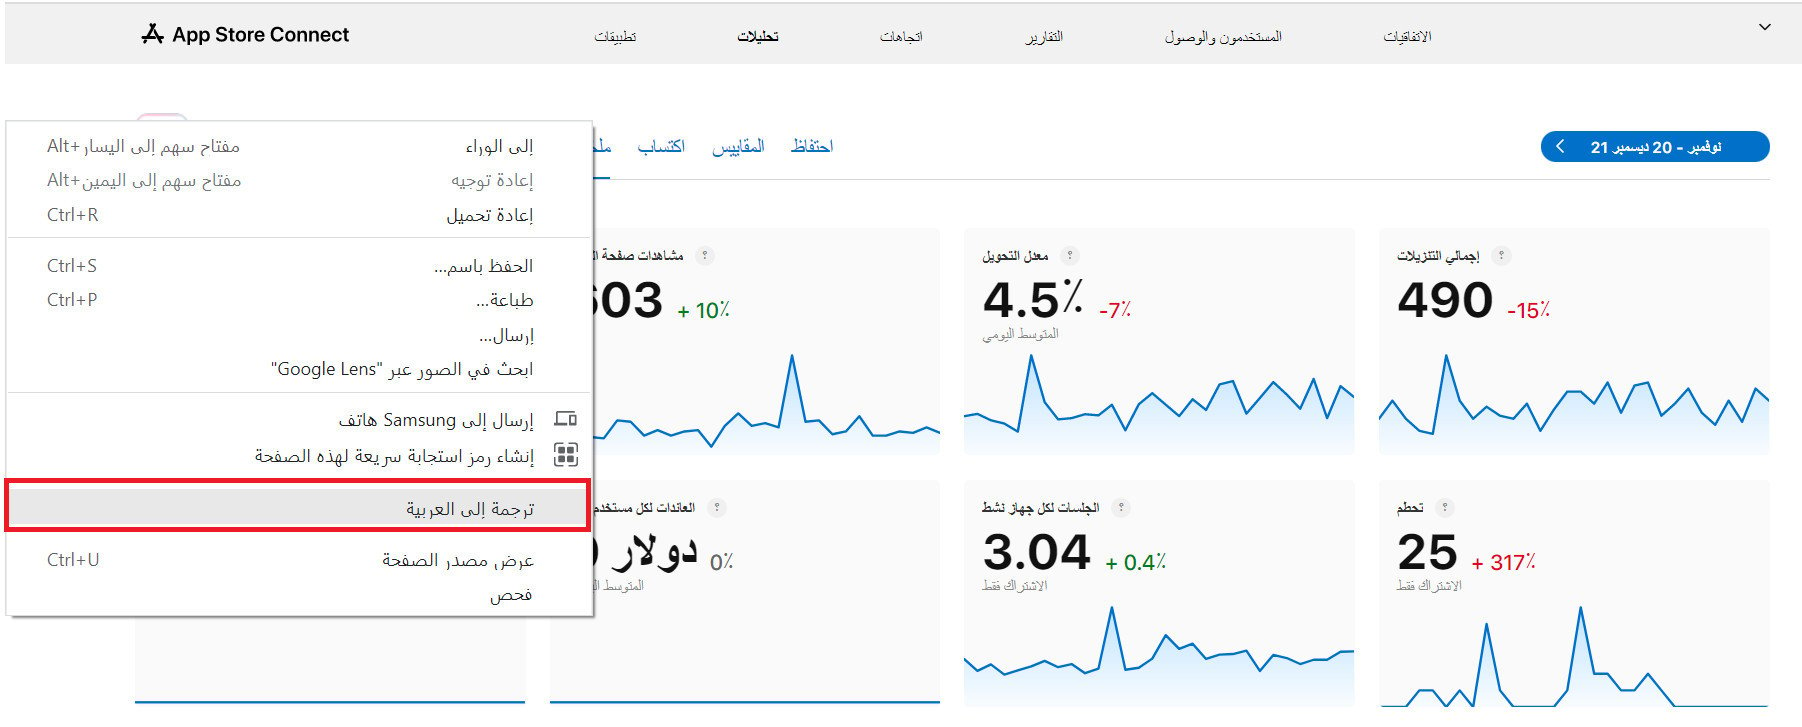
The App Analytics interface is not available in Arabic, but you can use your browser's translator to translate the page.
Frequently asked questions
Here are the questions we'll answer:
- How do I set the date range the statistics cover?
- How do I change what the worldwide distribution map report shows?
- How do I find out which sources my app's users came from?
- How do I find out which device types the app was downloaded on?
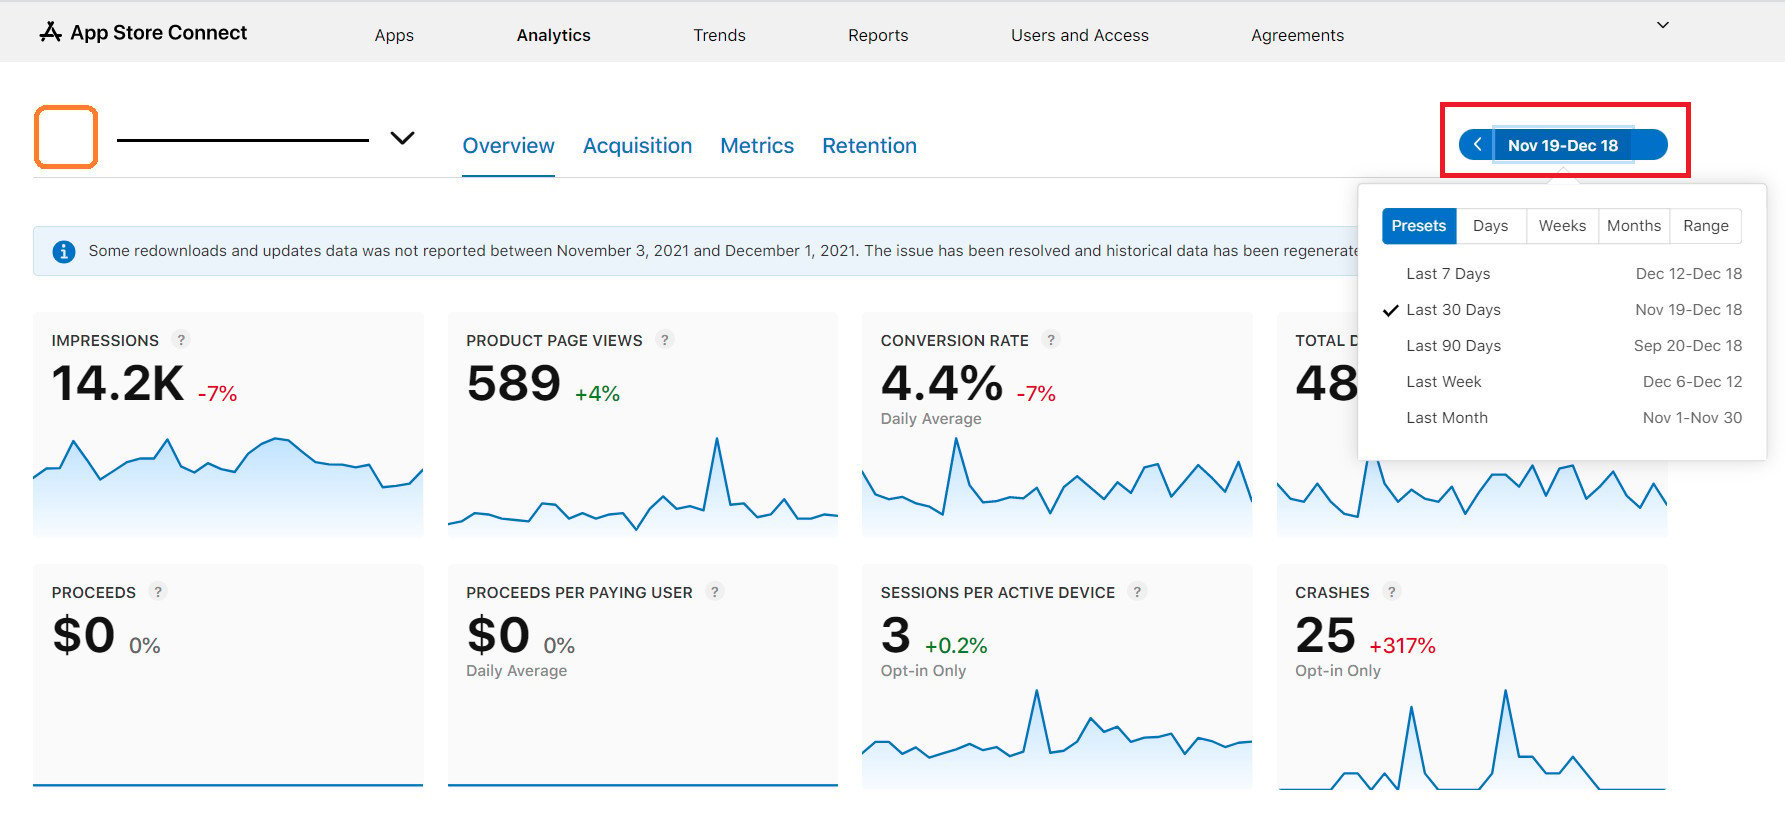
❓ How do I set the date range the statistics cover?
From the Overview tab, click the date icon and choose the date range you want from the list.
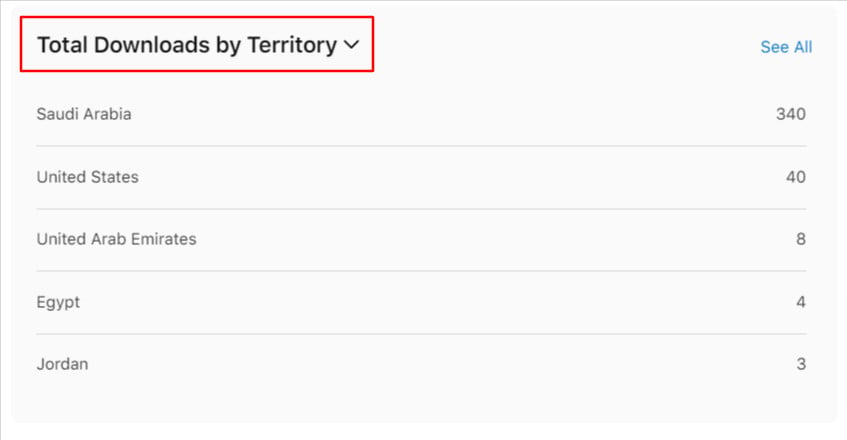
❓ How do I change what the worldwide distribution map report shows?
From the Overview tab, open the territory list and choose the type of report you want. The territories are displayed like this:
❓ How do I find out which sources my app's users came from?
From the Overview tab, open the source list and choose the type of report you want. The sources are displayed like this:
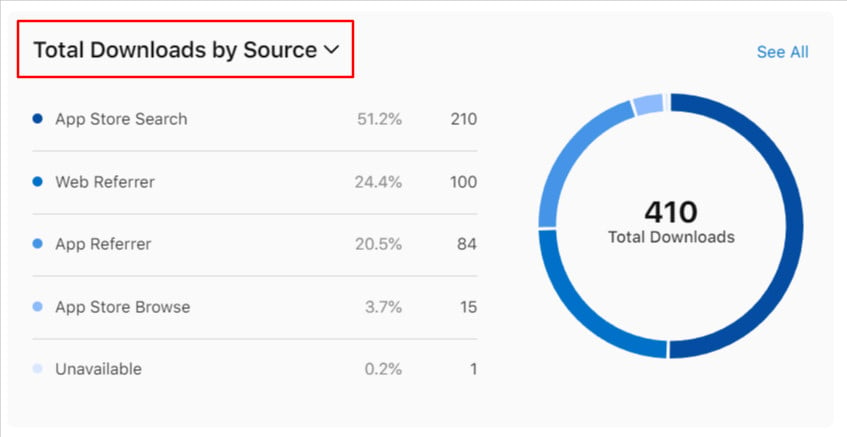
- App Store Search: customers who searched for your app, or tapped to download it for the first time, from App Store search. Includes Apple Search Ads.
- Web Referrer: customers who clicked a link on a website that brought them to your app's App Store page.
- App Referrer: customers who tapped a link in another app that took them to your app's App Store page. This includes apps that load your app page using the StoreKit API — useful for tracking marketing campaigns.
- App Store Browse: customers who saw your app, or tapped to download it for the first time, while browsing sections of the App Store, including the top charts and categories.
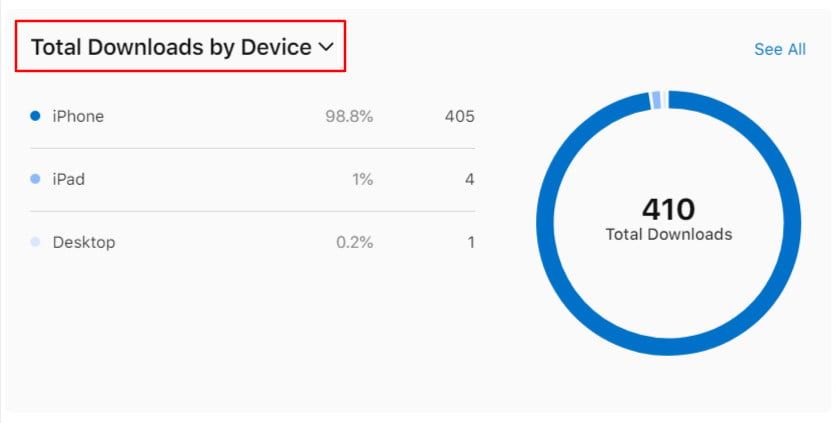
❓ How do I find out which device types the app was downloaded on?
From the Overview tab, open the device type list, then choose the type of report you want.
Checking App Analytics regularly tells you where your downloads really come from — so you can invest in the channels and markets that are already working.