How many people actually download and use your store's app — and where are they?
Once your store's app is live on Google Play, the numbers start telling a story. The statistics in Google Play Console show you how your app performs: active users, downloads by country, growth over time, and how you compare with similar apps. In this guide, you'll learn how to open your app statistics in Google Play Console, read each report, and filter the data by date and country.
To view app statistics, sign in at Google Play Console, choose your developer account, select your app, and click (Statistics) from the side menu. You can then set the time period and countries for the report, explore the time series, change analysis, data table, and compare your growth with similar apps.
📌 Article overview
- How to open your app statistics in Google Play Console
- What the statistics page shows
- Frequently asked questions
👣 How to open your app statistics in Google Play Console
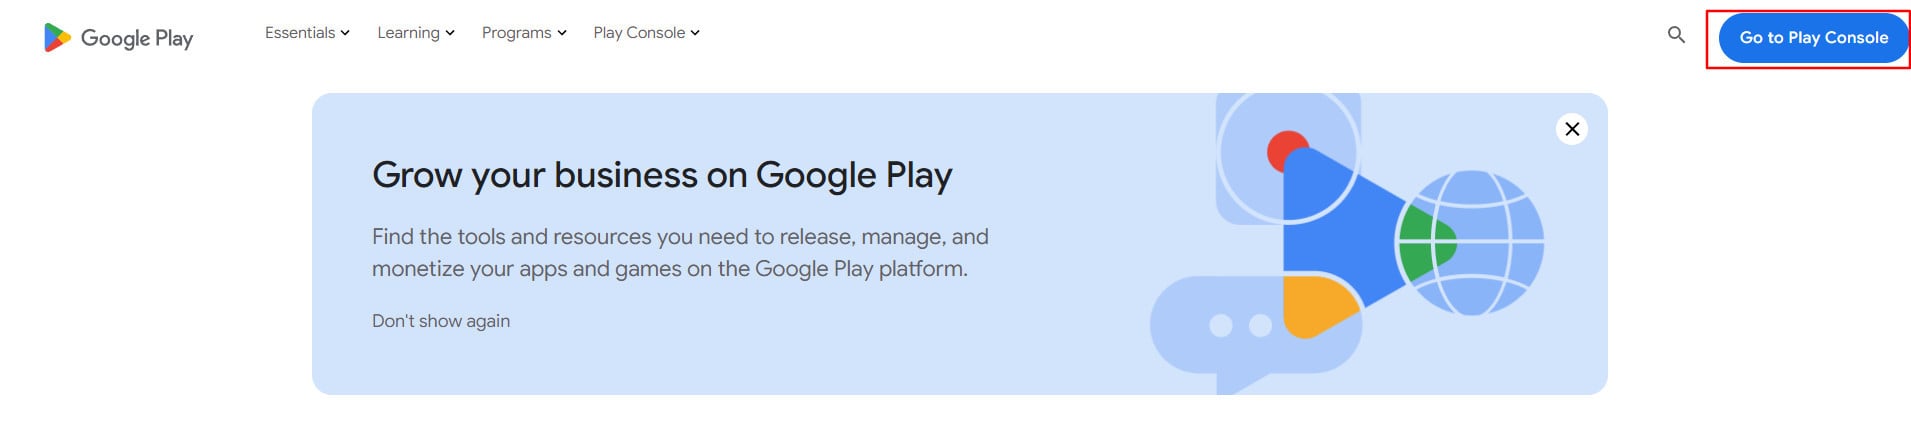
1. Go to Google Play Console, then click (Go to Play Console).
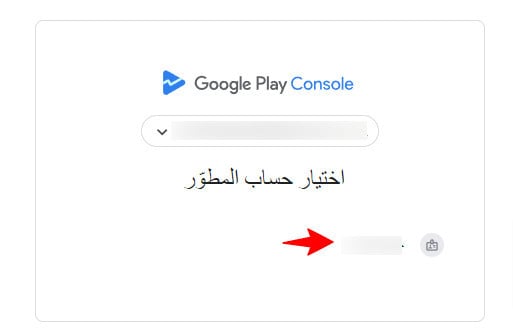
2. Choose the developer account linked to your email. If the developer account doesn't appear among the options, make sure you signed in with the right email — or that you finished creating a developer account. For details, see buying a Google Play Console developer account.
3. From the account's home page, select the app whose statistics you want to view.
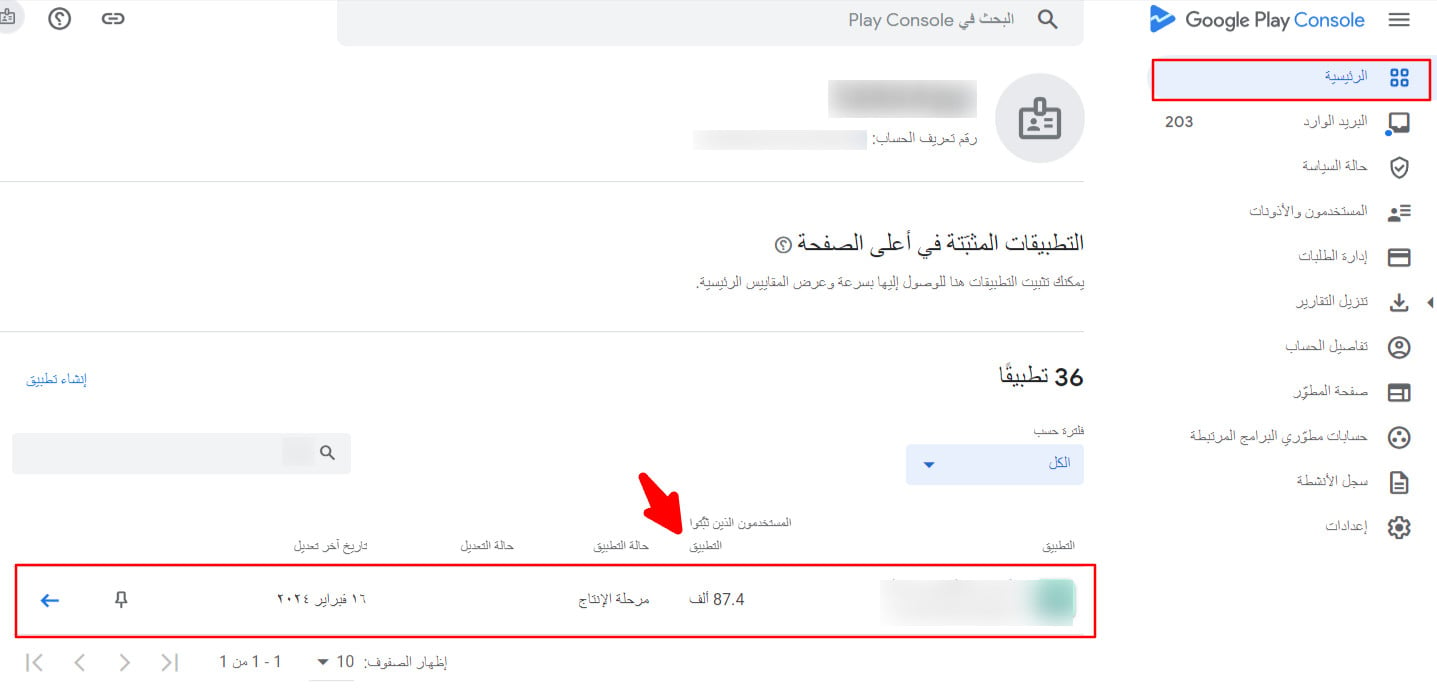
Notice that some key information appears next to each app — including the approximate number of users who installed it, which is usually the total you want to know.
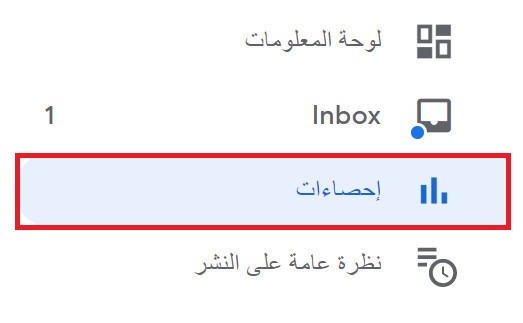
4. After opening the app, click (Statistics) from the side menu of the app's Google Play dashboard.
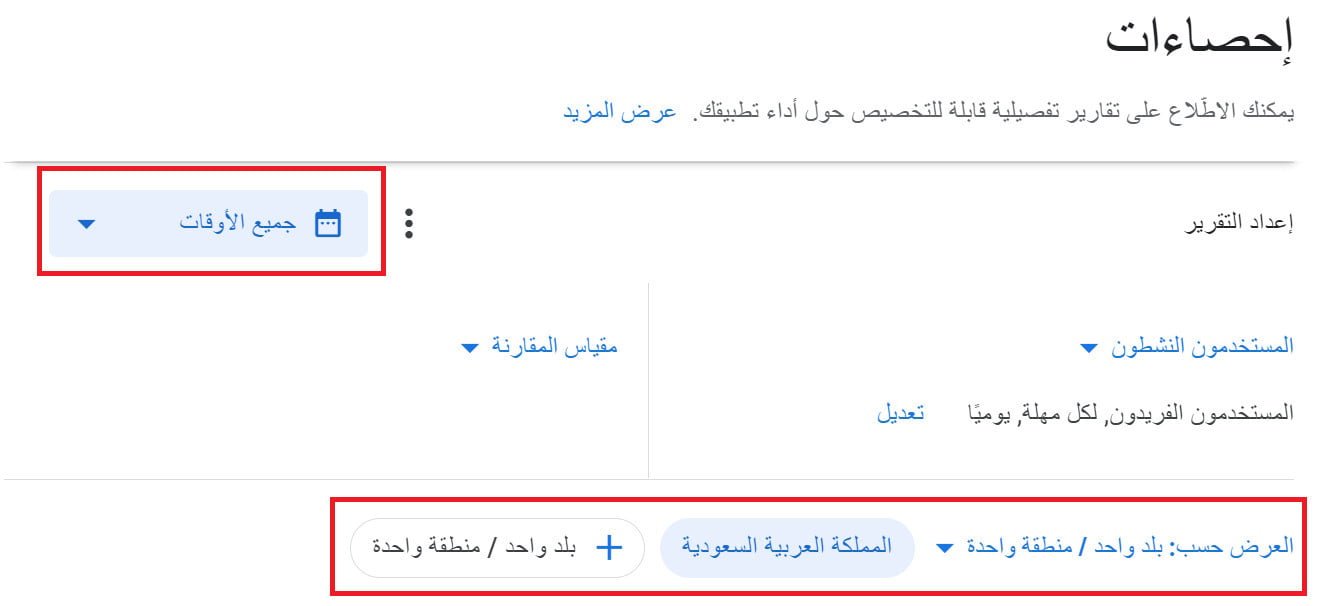
5. Set the period the report should cover, along with the countries and regions you want detailed in the report.
🎯 What the statistics page shows
The page displays a variety of statistics about your app. The most important are:
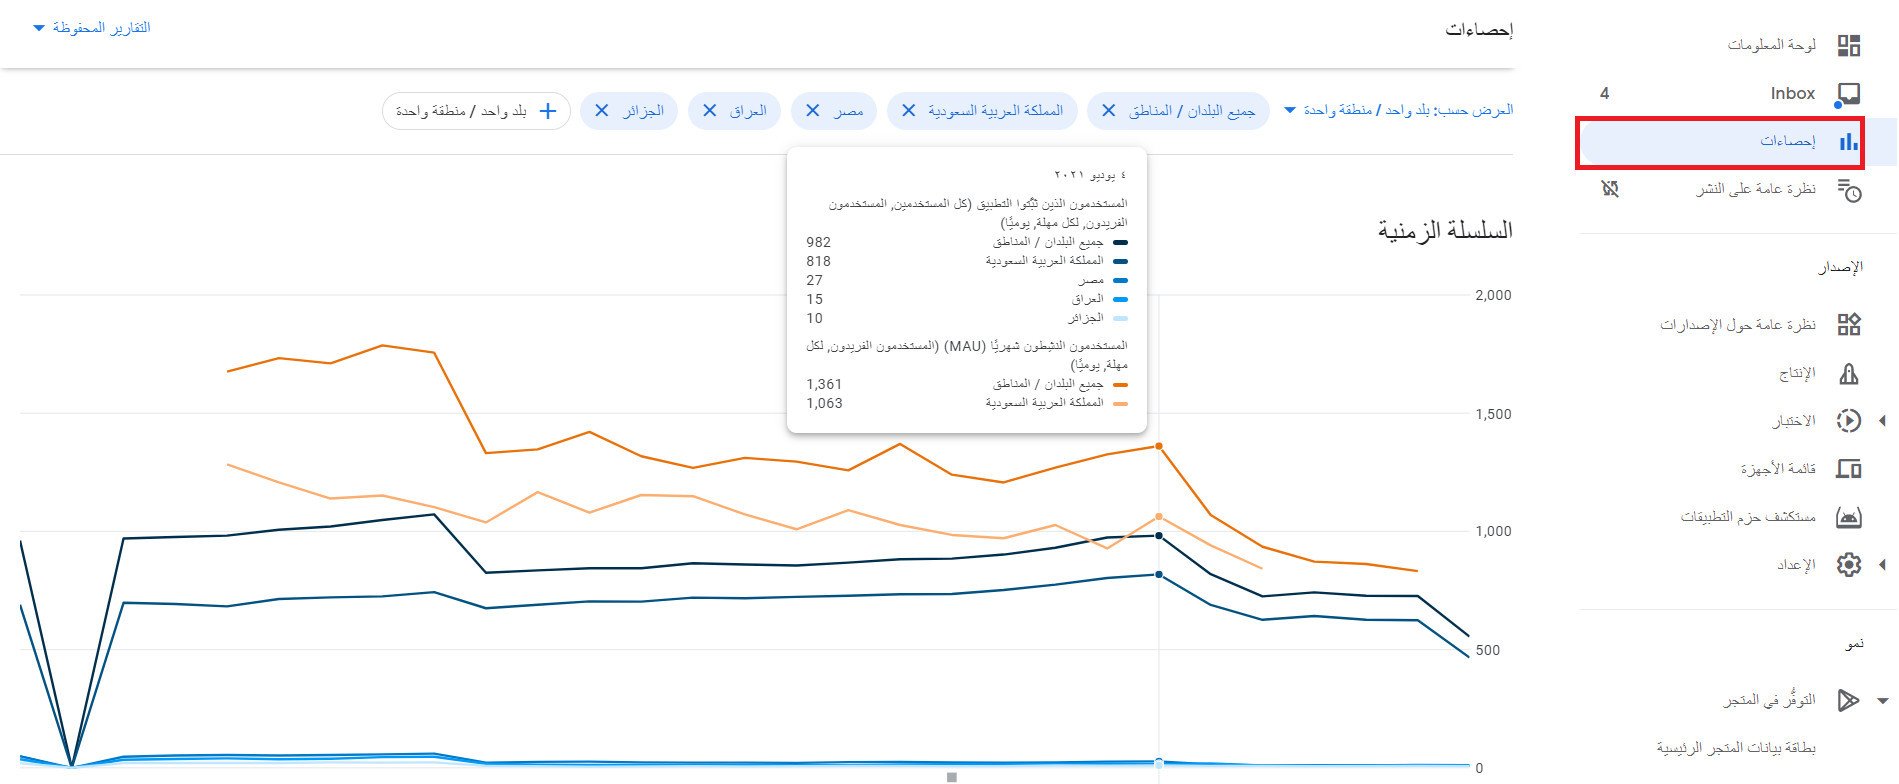
1. Time series
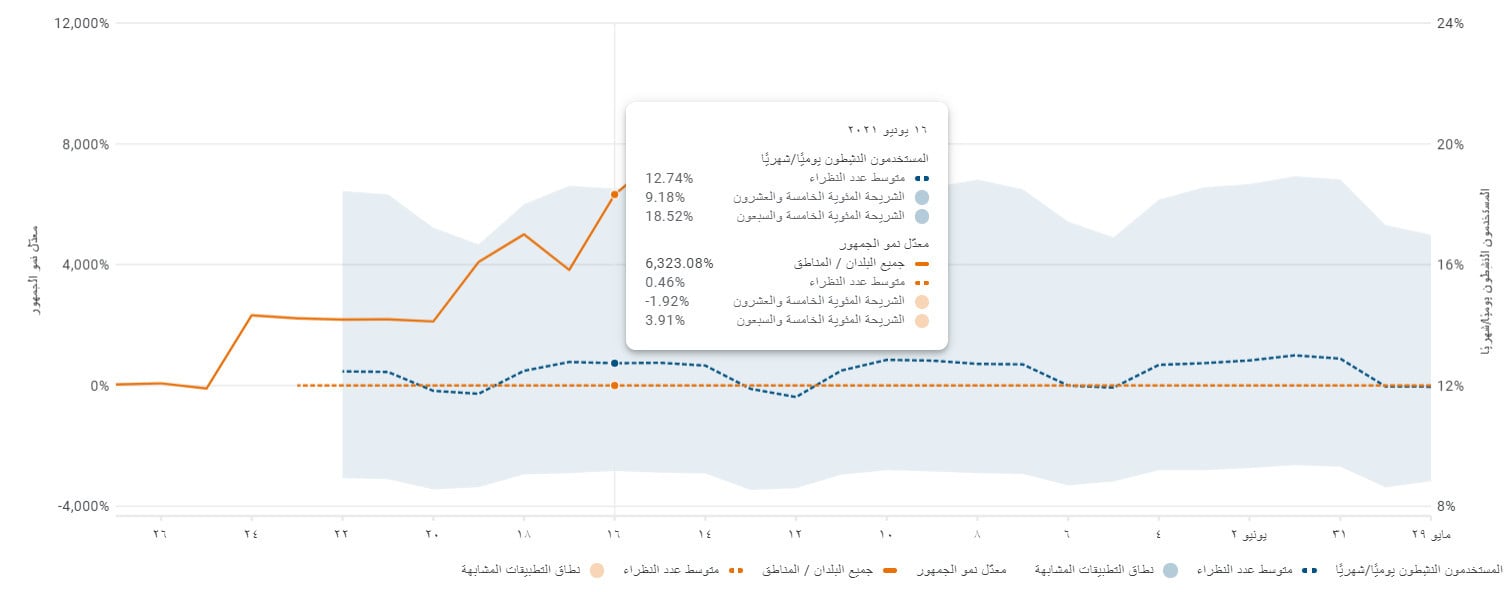
The time series shows a line chart of your app's active users for the period and countries the report covers. Move along the timeline to see how user numbers changed.
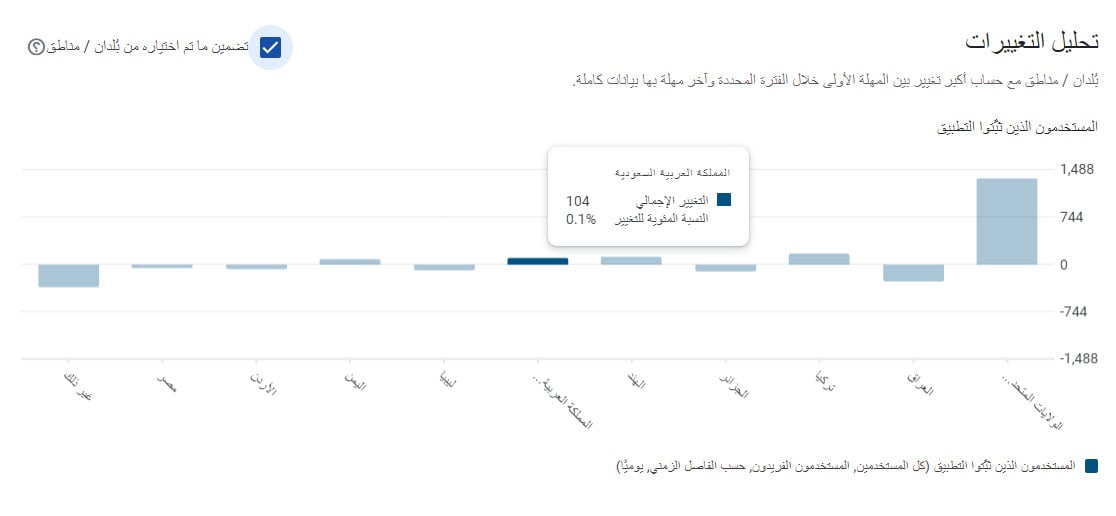
2. Change analysis
Countries/regions with the biggest change between the first period in the selected date range and the latest period with complete data — in other words, how much downloads grew over the report's date range.
3. Data table
Shows the number of downloads and the percentage for the countries you selected, according to the report's date range.
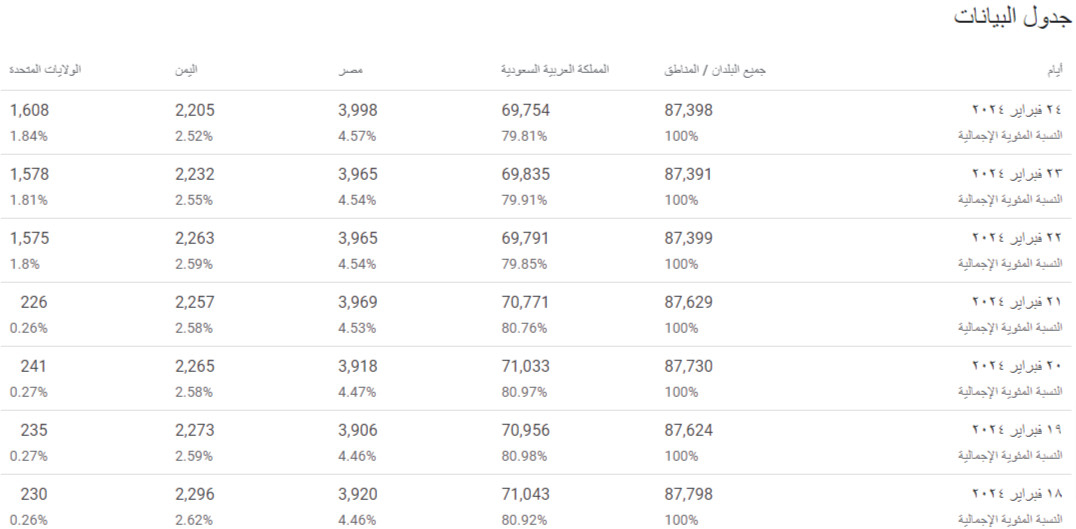
4. Comparison with similar apps
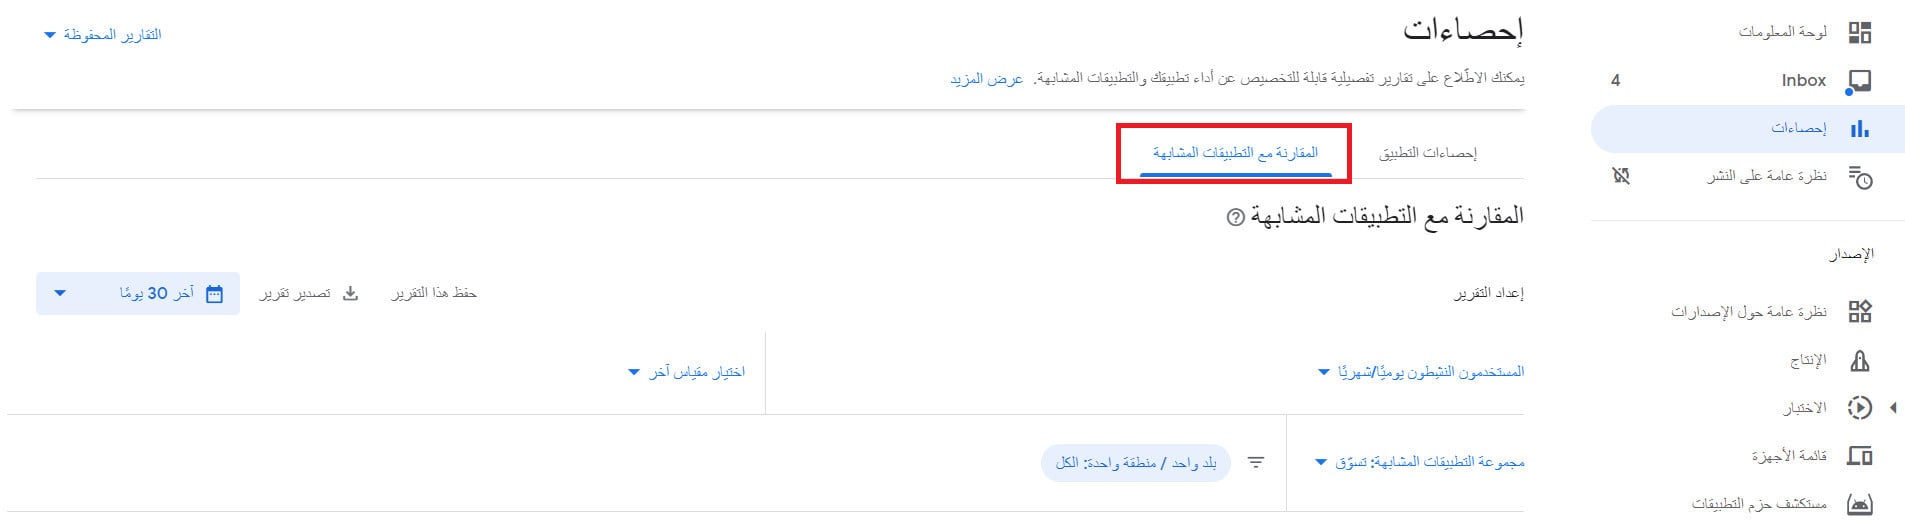
You can compare your app's growth rate against any group of apps. Click (Similar app group) and pick the category you want, then use (Choose another metric) to set the comparison metric.
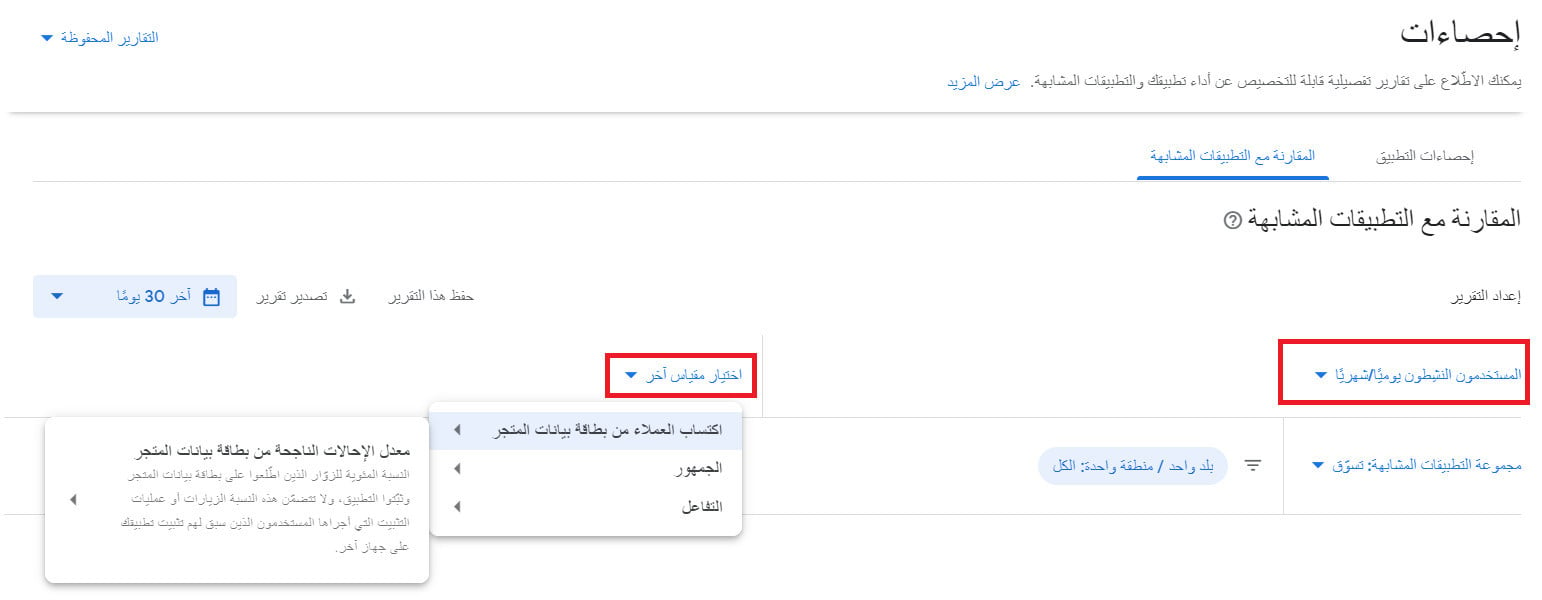
For more details, see using Google Play Console to track app performance.
❓ Frequently asked questions
Are there metrics other than active users in the statistics?
Yes, there are many. To reach them, click (Comparison metric), then click the metric you want, then click any sub-metric under the main one.
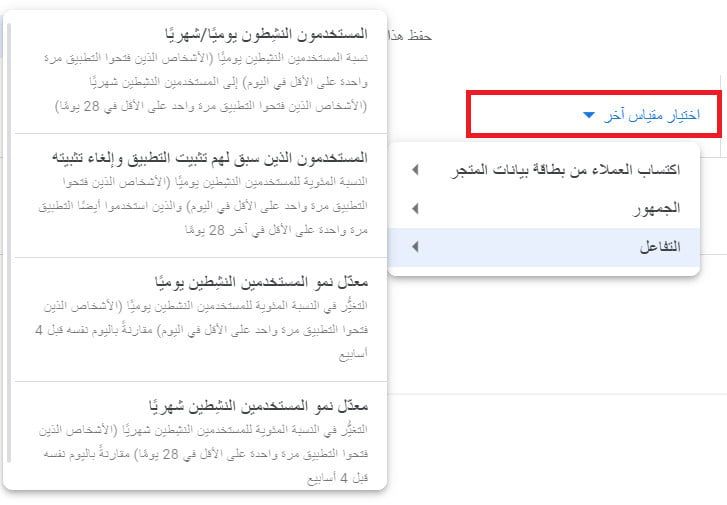
💡 Example: the audience growth rate report:
How do I add a country or region to the statistics view?
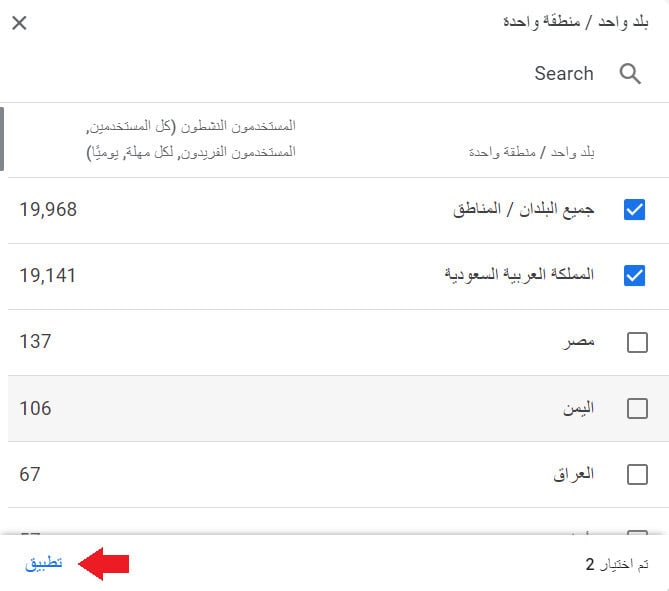
1. From the statistics page, click (+ 1 country/region).

2. Choose the countries whose statistics you want in the report, then click (Apply).
How do I set the date range for the data?
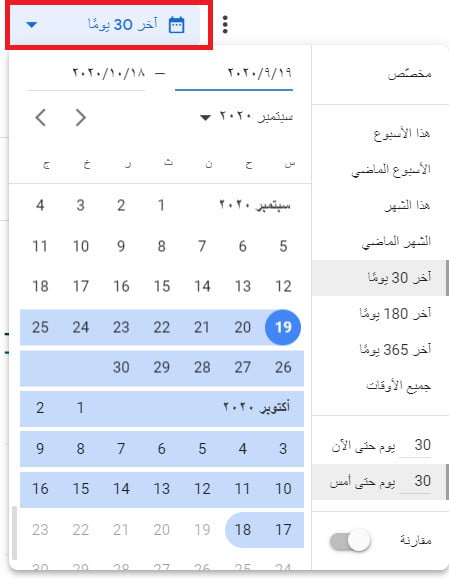
From the statistics page, click the date menu and choose the time period you want the data to cover. It appears like this: