Tracking shipment performance and evaluating the efficiency of your shipping partners no longer needs to be a challenge.
The shipping performance page gives you a centralized, data-driven view of all shipping activities across your store. It helps you monitor performance, improve delivery efficiency, and make informed operational decisions at the right time.
📌 Article overview
- Shipping performance page
- Managing the shipping performance page
- Practical use cases
✅ All reports displayed on the page apply exclusively to shipping companies operating through Salla Shipping Policies.
Shipping performance page
- From your store dashboard, open the All menu and click Shipping & Delivery.
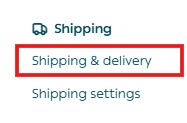
2. From the Shipping page, select the Shipping performance tab.

The page will appear, displaying the following key reports:
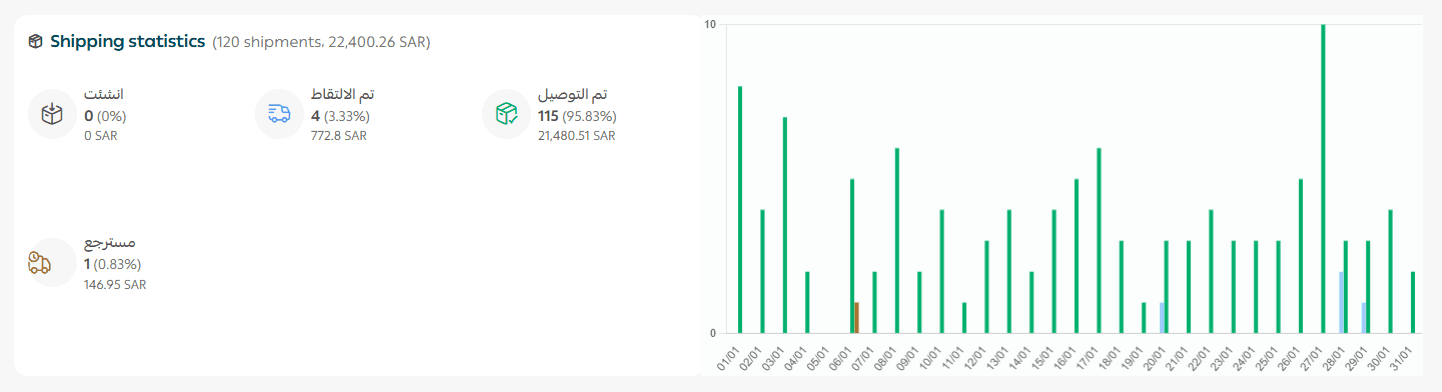
Shipping Statistics
This report shows shipment activity across all shipping companies used during the selected reporting period.
It includes:
- Total number of shipments created
- Number of shipments picked up
- Number of shipments delivered
- Number of returned shipments
Shipping Companies Performance
This report provides insights into:
- Total number of orders and their total value
- Active shipping companies under Salla Shipping Policies
- Each company’s contribution to total shipments (by volume and value)
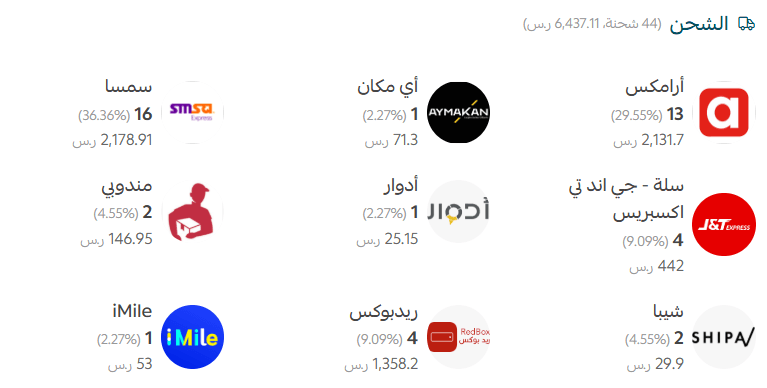
Example: SMSA
- 16 orders – Number of shipments handled by SMSA
- SAR/AED 2178.91 – Total value of orders shipped via SMSA
- 36.36% – SMSA’s share of total shipments
Payment Statistics
This report displays:
- Total number of orders and total order value
- Payment methods used, along with order counts and contribution percentages

Example: Bank Transfer
- 29 orders – Orders paid via bank transfer
- SAR/AED 4413.07 – Total value of bank transfer payments
- 65.91% – Share of bank transfer payments from total order value
Important note: Bank transfer payments are currently available only for stores in Saudi Arabia.
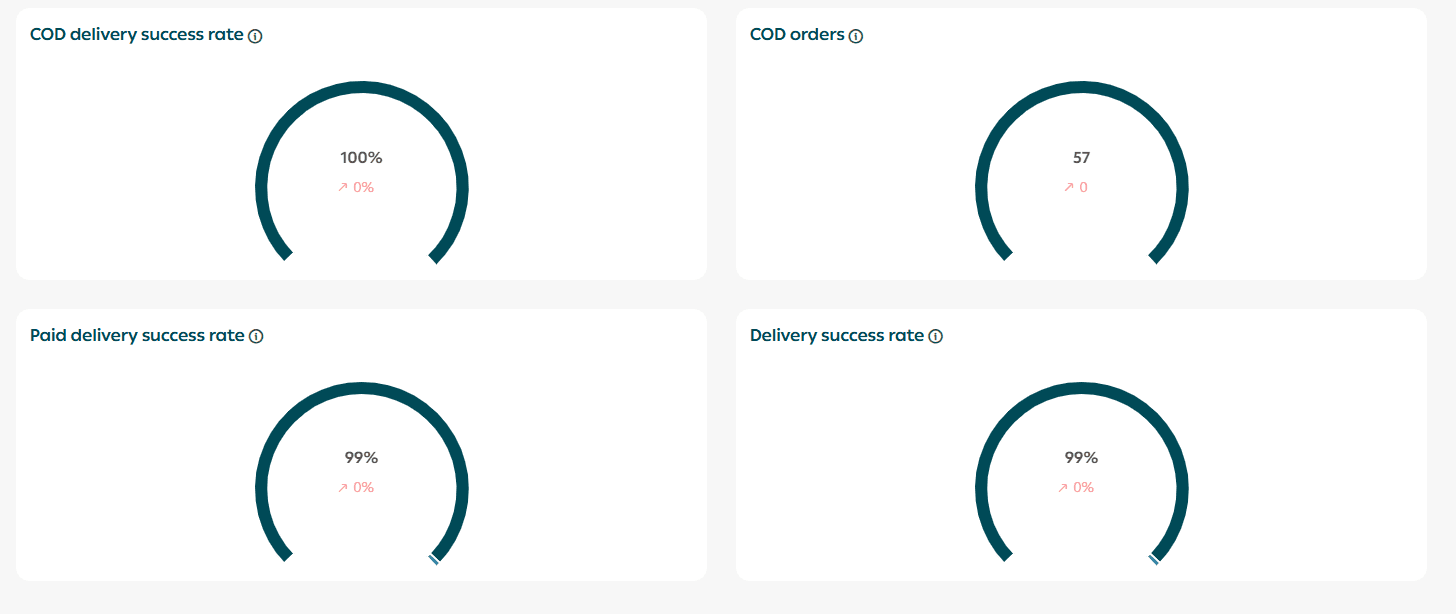
Overall Performance Metrics
- Cash on delivery (COD) success rate
Percentage of COD shipments successfully delivered compared to returned shipments
- Confirmed COD orders
Total COD orders received by customers versus returned orders
- Paid shipments success rate
Percentage of electronically paid shipments delivered versus returned
- Overall delivery success rate
Percentage of delivered shipments compared to returned shipments
Each metric is accompanied by a green or red indicator showing improvement or decline compared to previous performance.
Managing the page
Operational Filters
You can refine and analyze your data using advanced filters, including:
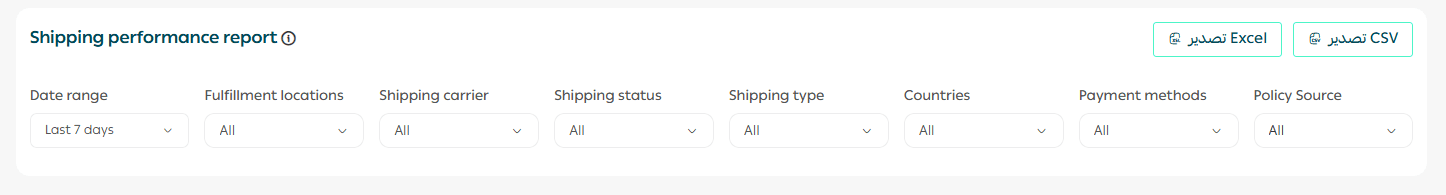
- Specific time periods
- All branches or selected branches
- All shipping companies or selected providers
Important note: Salla Shipping Policies are currently available only for stores in Saudi Arabia.
- Shipment status (Created, Picked Up, Delivered, Returned)
- Shipment type (Standard, Chilled, Economy, Express, International, Heavy)
- All countries or selected countries
- Active payment methods
- Policy source (Salla Shipping Policies or third-party shipping apps)
For more details, see:
- Activating payment methods in your store
- Shipping and delivery settings within Salla Shipping Policies
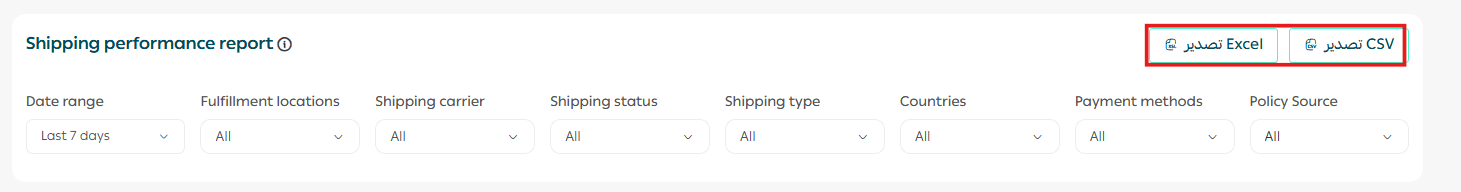
Export shipping analysis
To export shipping and operational reports:
- Select the file format (Excel or CSV)
- The report will be sent directly to your store’s registered email address
Practical use cases for the shipping performance page
Analyzing shipping company performance
- Problem: Customers reported frequent delivery delays and missed shipments.
- Solution: The merchant reviewed delivery success and return rates per shipping company using the operations management page.
- Outcome: A shipping provider with high return rates was replaced, resulting in a 30% reduction in returns and higher customer satisfaction.
Monitoring the impact of payment methods on returns
- Problem: Orders using Cash on Delivery were returned more frequently than prepaid orders.
- Solution: Payment reports revealed that 60% of returned shipments were COD orders.
- Outcome: The store introduced incentives for prepaid payments, reducing returns by 25% within three months.
Optimizing warehousing and distribution
- Problem: Repeated delivery delays in certain cities reduced customer satisfaction.
- Solution: Pickup and delivery time reports showed that shipments from a specific warehouse were delayed due to distance.
- Outcome: Opening an additional warehouse closer to customers reduced average delivery time by 40%.
Improving marketing and free shipping campaigns
- Problem: The store wanted to offer free shipping but was unsure about cost impact.
- Solution: Shipping cost analysis revealed a low-cost delivery option in selected cities.
- Outcome: A targeted “Free Shipping in Selected Cities” campaign increased orders by 20% without affecting profit margins.
Preparing for peak seasons
- Problem: Order volume increased significantly during promotional seasons, causing fulfillment challenges.
- Solution: Historical operations data showed a 50% spike in orders during annual sales periods.
- Outcome: The merchant expanded operational capacity and partnered with additional carriers ahead of peak season, ensuring smooth fulfillment with no delivery delays.